EMC2
[ENSRNOP00000006890]
Main page
| | | Plot |
Mito |
Lyso |
|
Perox |
ER |
Golgi |
PM |
Cytosol |
Nucleus |
|
| Expt A |
 8
8
peptides |
34
spectra |
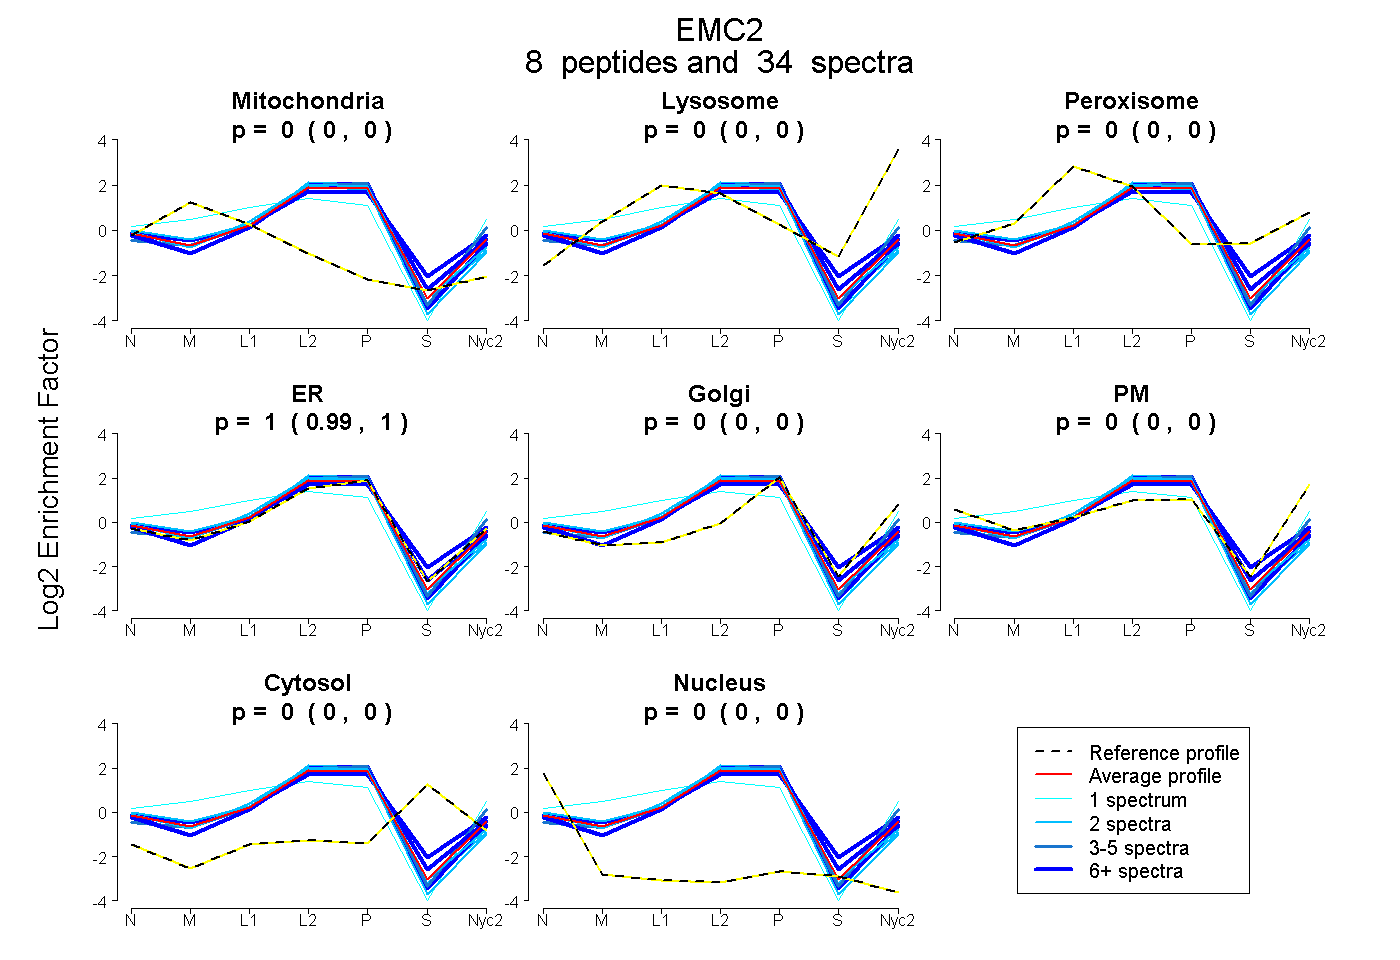 |
0.000
0.000 | 0.003 |
0.000
0.000 | 0.000 |
|
0.000
0.000 | 0.004 |
1.000
0.994 | 1.000 |
0.000
0.000 | 0.000 |
0.000
0.000 | 0.000 |
0.000
0.000 | 0.000 |
0.000
0.000 | 0.000 |
|
| | | Plot |
Mito |
|
Lyso or Perox |
|
ER |
Golgi |
PM |
Cytosol |
Nucleus |
|
| Expt B |
5
peptides |
13
spectra |
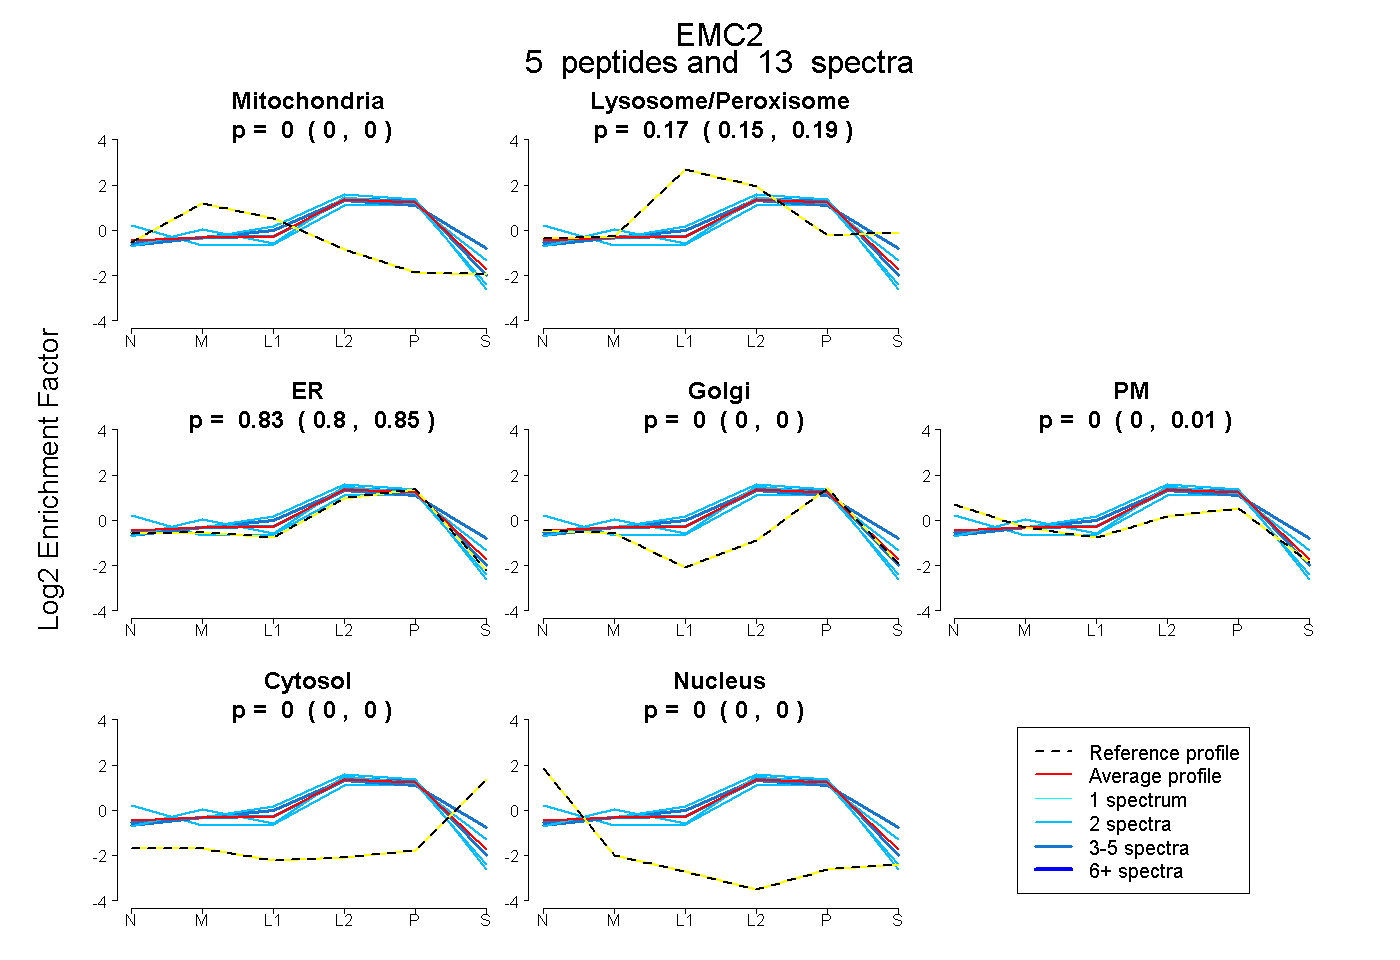 |
0.000
0.000 | 0.000 |
|
0.174
0.147 | 0.195 |
|
0.826
0.795 | 0.848 |
0.000
0.000 | 0.000 |
0.000
0.000 | 0.012 |
0.000
0.000 | 0.000 |
0.000
0.000 | 0.000 |
|
| 2 spectra, YTQGGLENLELSR |
0.027 |
|
0.044 |
|
0.930 |
0.000 |
0.000 |
0.000 |
0.000 |
|
| 4 spectra, YDDAIQLYDR |
0.000 |
|
0.255 |
|
0.661 |
0.000 |
0.000 |
0.084 |
0.000 |
|
| 2 spectra, ILQEDPTNTAAR |
0.000 |
|
0.121 |
|
0.510 |
0.000 |
0.351 |
0.017 |
0.000 |
|
| 3 spectra, AYQFAGR |
0.000 |
|
0.182 |
|
0.818 |
0.000 |
0.000 |
0.000 |
0.000 |
|
| 2 spectra, NVEAIR |
0.000 |
|
0.153 |
|
0.847 |
0.000 |
0.000 |
0.000 |
0.000 |
|
| | | Plot |
|
Lyso |
|
|
|
|
|
|
|
Other |
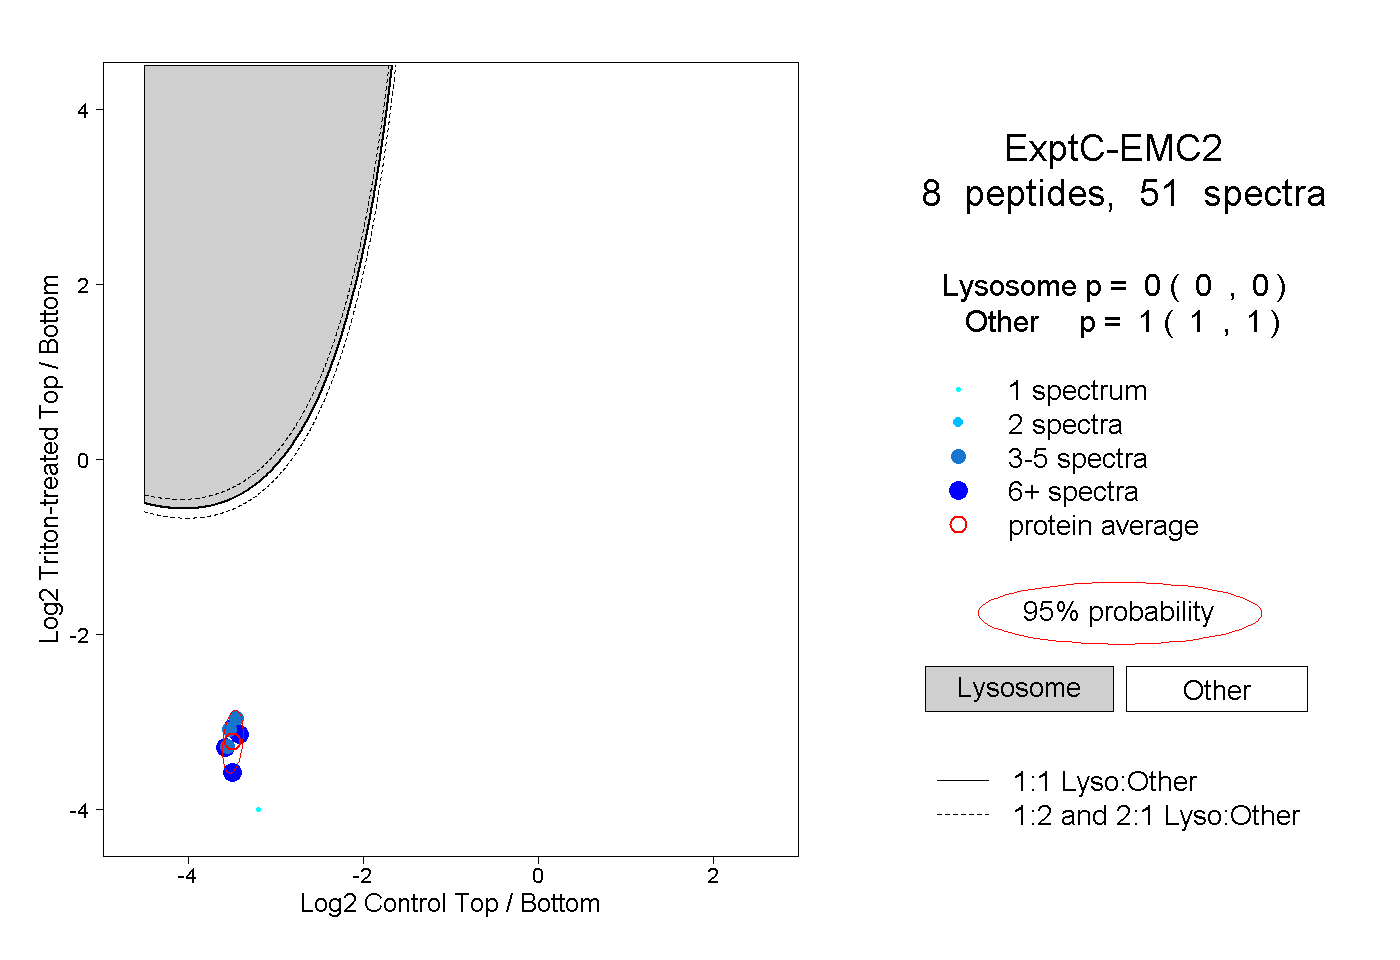
| Expt C |
8
peptides |
51
spectra |
 |
|
0.000
0.000 | 0.000 |
|
|
|
|
|
|
|
1.000
1.000 | 1.000 |
| | | Plot |
|
Lyso |
|
|
|
|
|
|
|
Other |
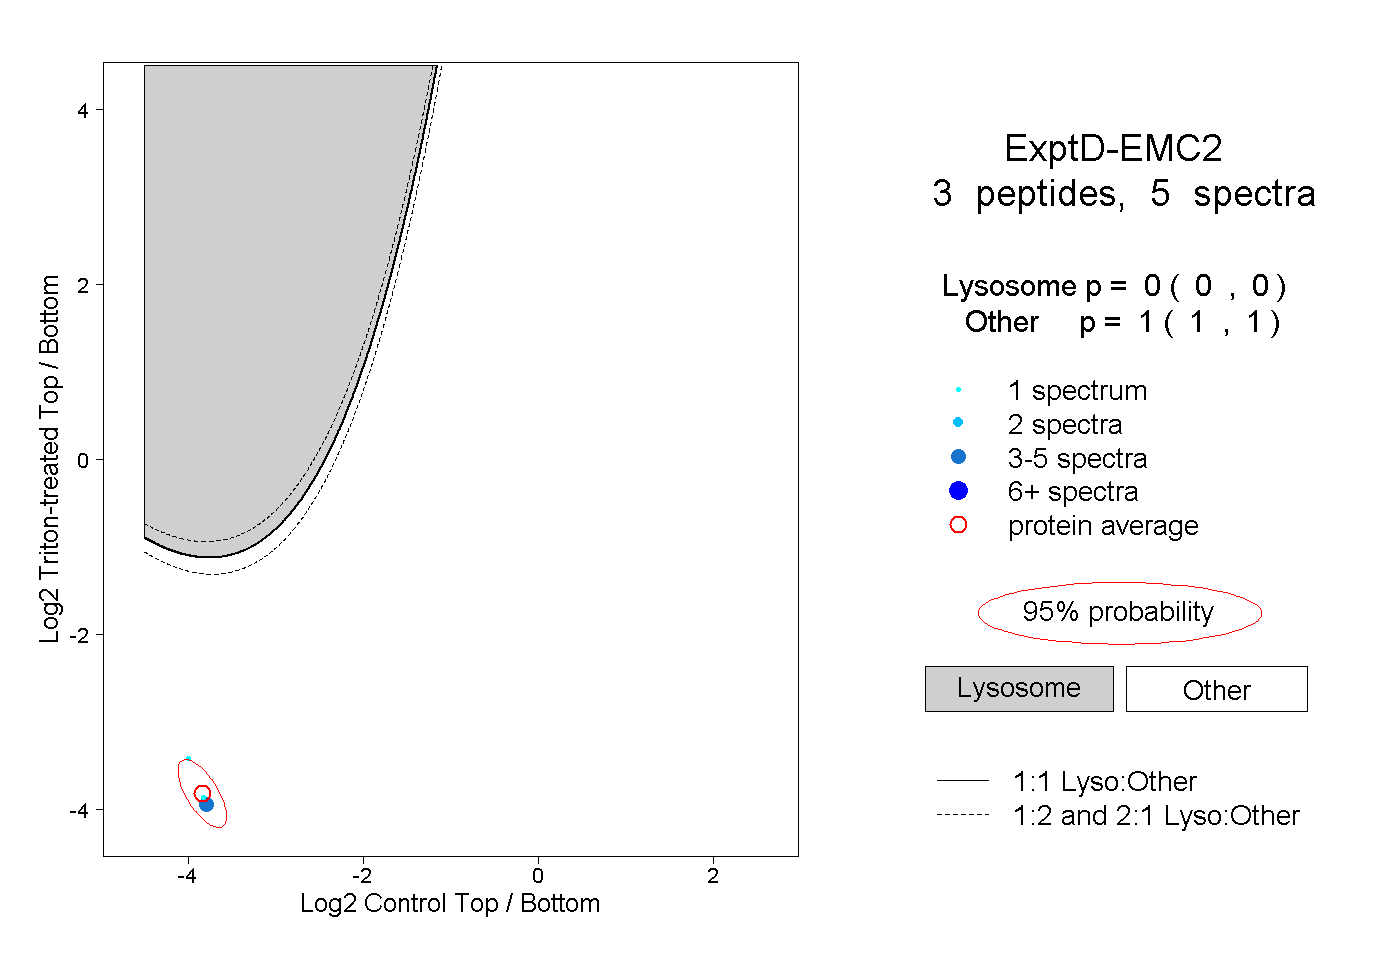
| Expt D |
3
peptides |
5
spectra |
 |
|
0.000
0.000 | 0.000 |
|
|
|
|
|
|
|
1.000
1.000 | 1.000 |