 9
9peptides
spectra
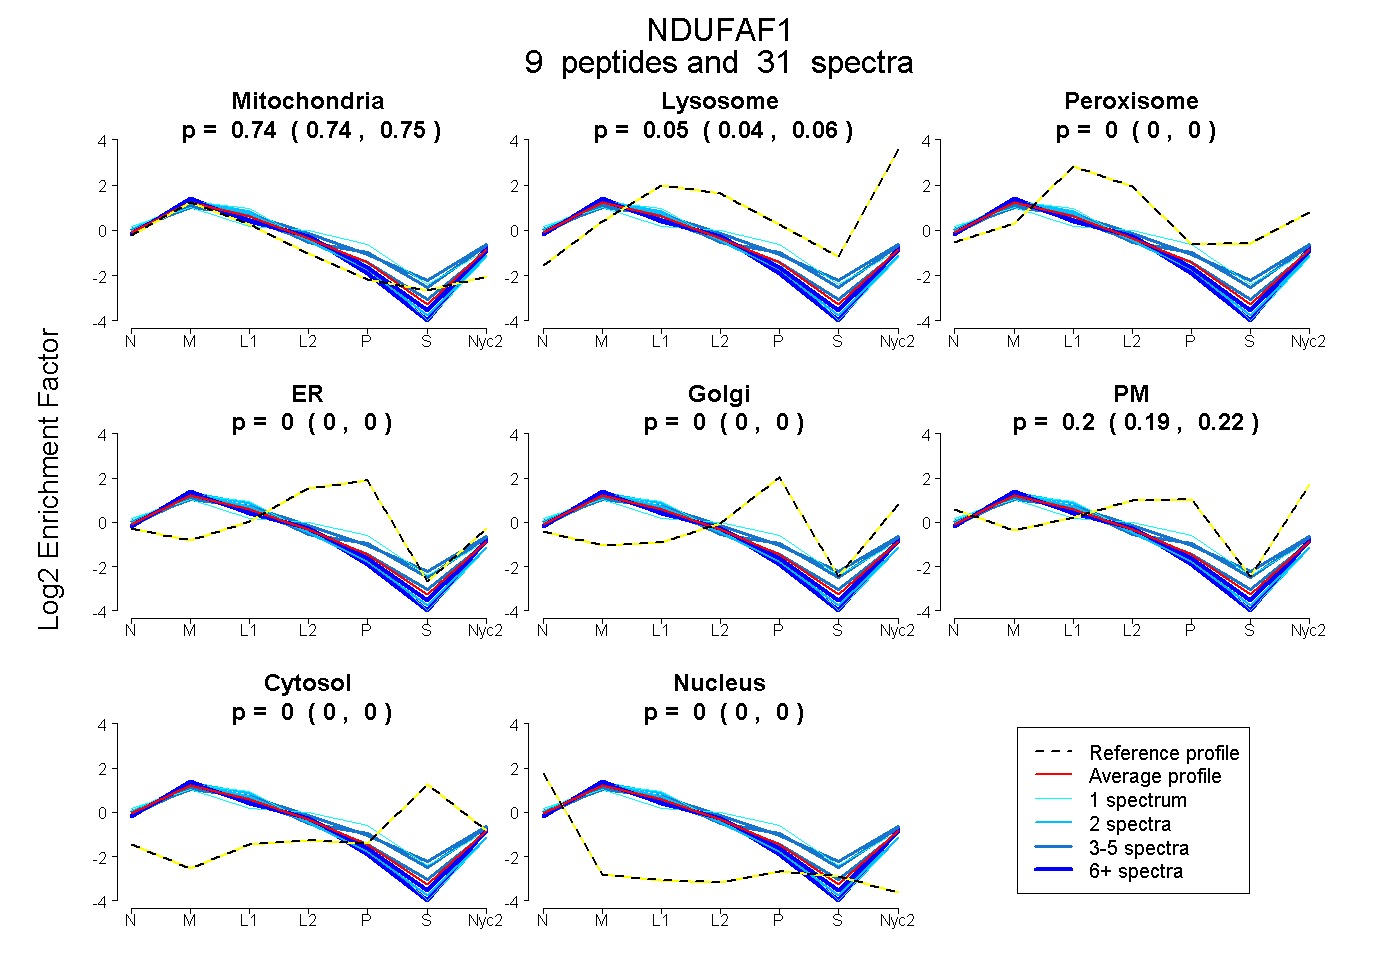
0.738 | 0.749
0.041 | 0.060
0.000 | 0.000
0.000 | 0.000
0.000 | 0.000
0.191 | 0.215
0.000 | 0.000
0.000 | 0.000
3peptides
spectra
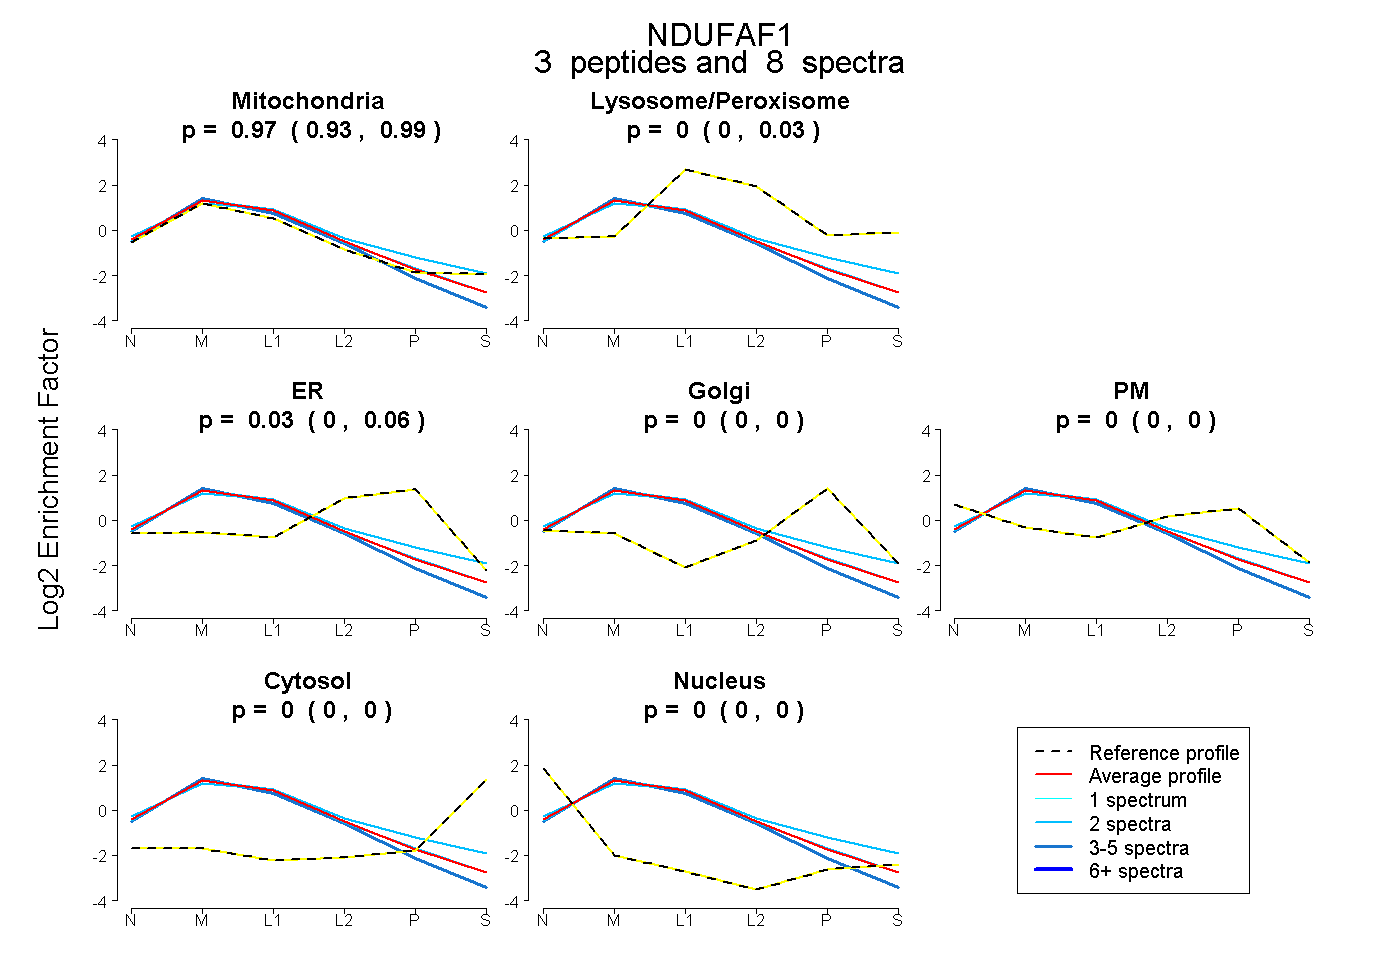
0.931 | 0.992
0.000 | 0.026
0.000 | 0.061
0.000 | 0.000
0.000 | 0.000
0.000 | 0.000
0.000 | 0.000
15peptides
spectra
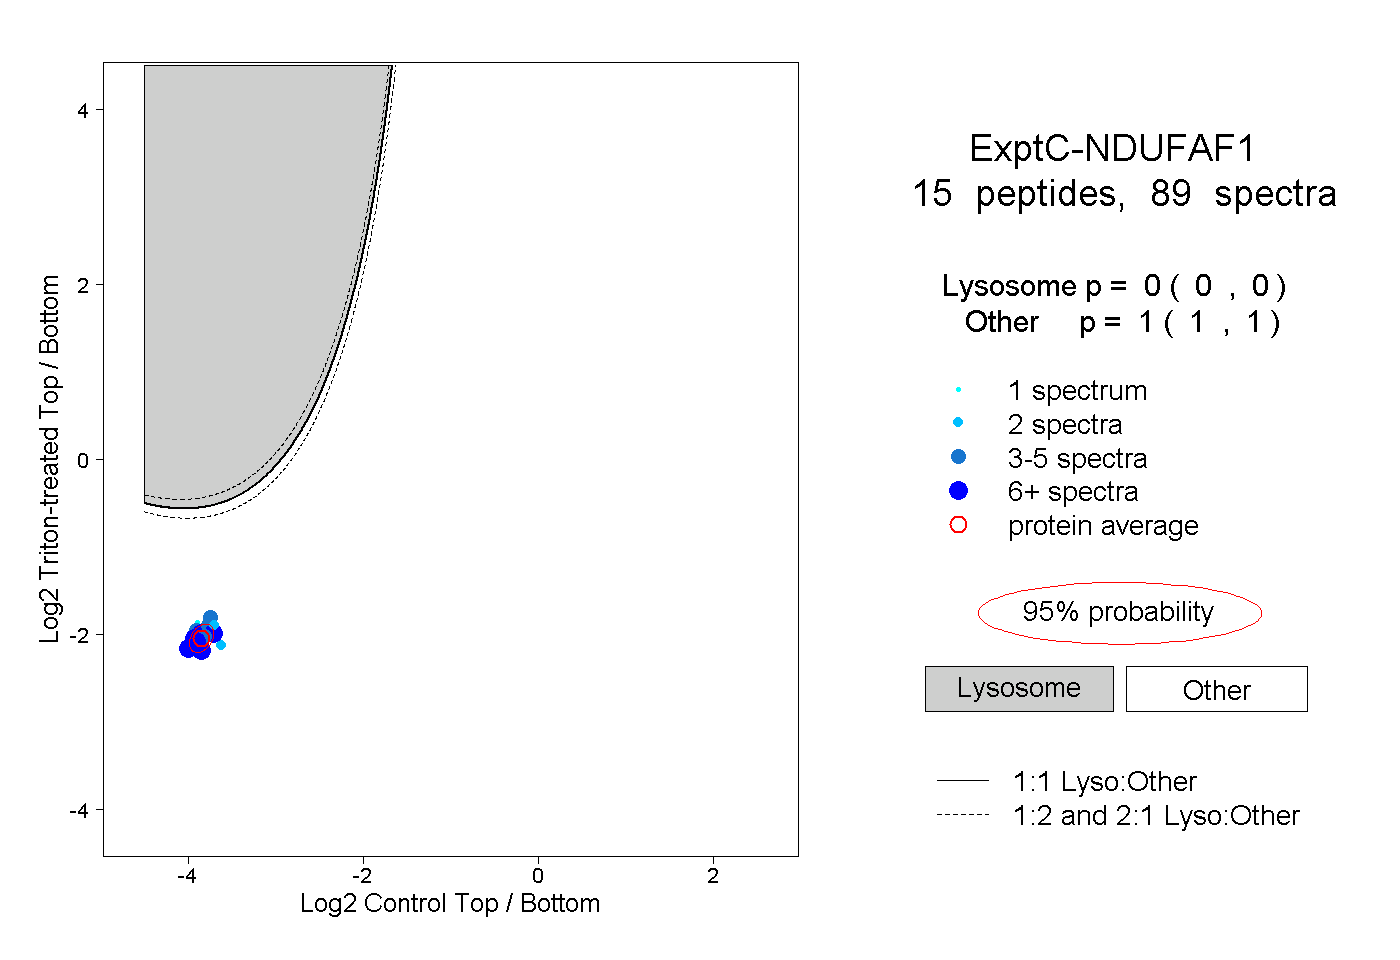
0.000 | 0.000
1.000 | 1.000
3peptides
spectra
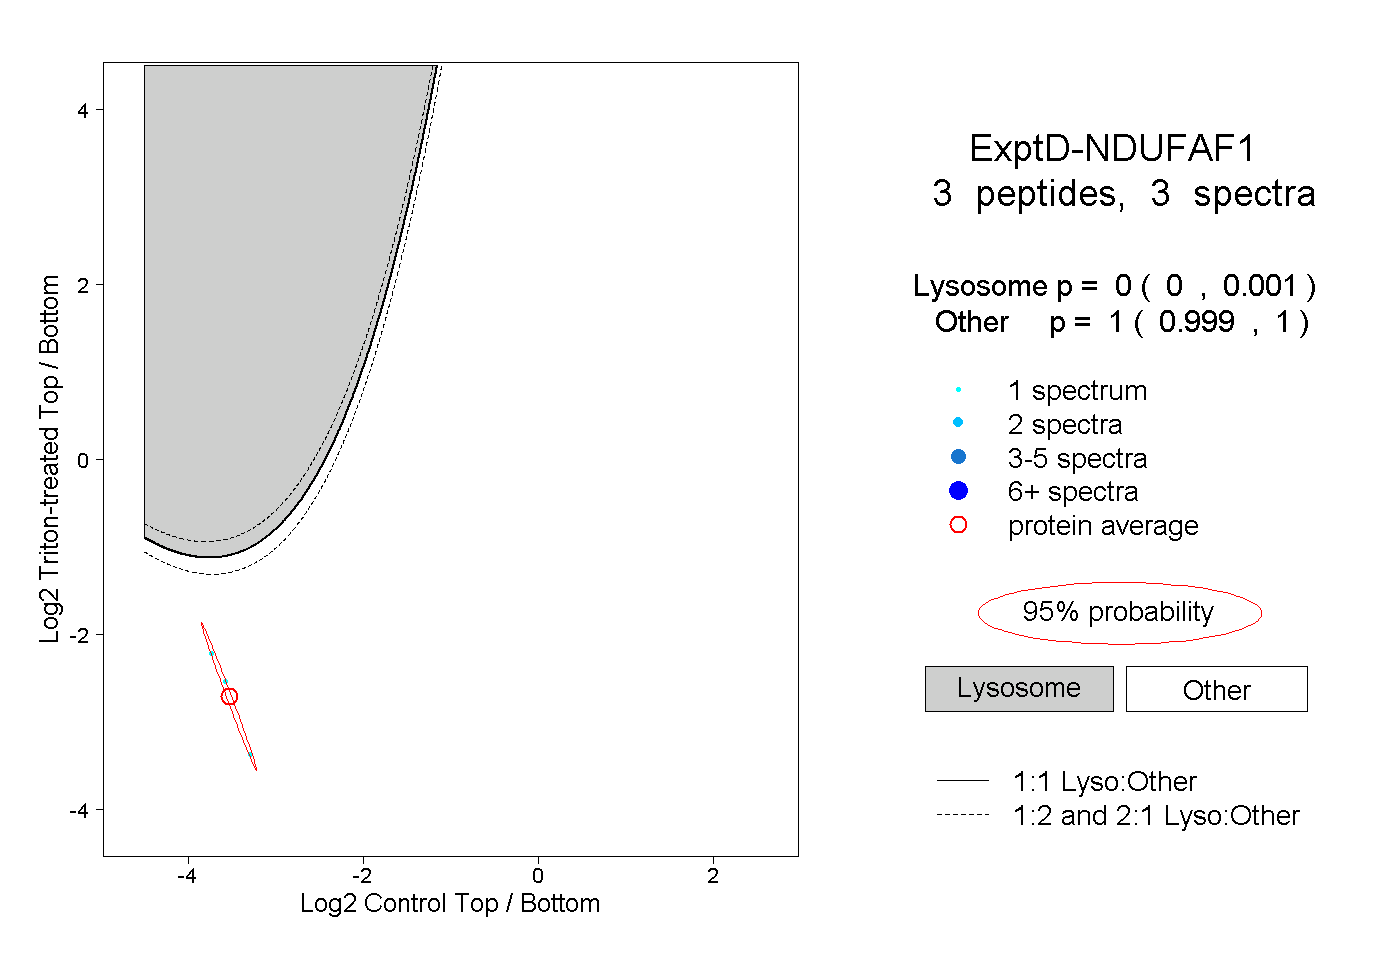
0.000 | 0.001
0.999 | 1.000