 9
9peptides
spectra
0.738 | 0.749
0.041 | 0.060
0.000 | 0.000
0.000 | 0.000
0.000 | 0.000
0.191 | 0.215
0.000 | 0.000
0.000 | 0.000
| Plot | Mito | Lyso | Perox | ER | Golgi | PM | Cytosol | Nucleus | |||||
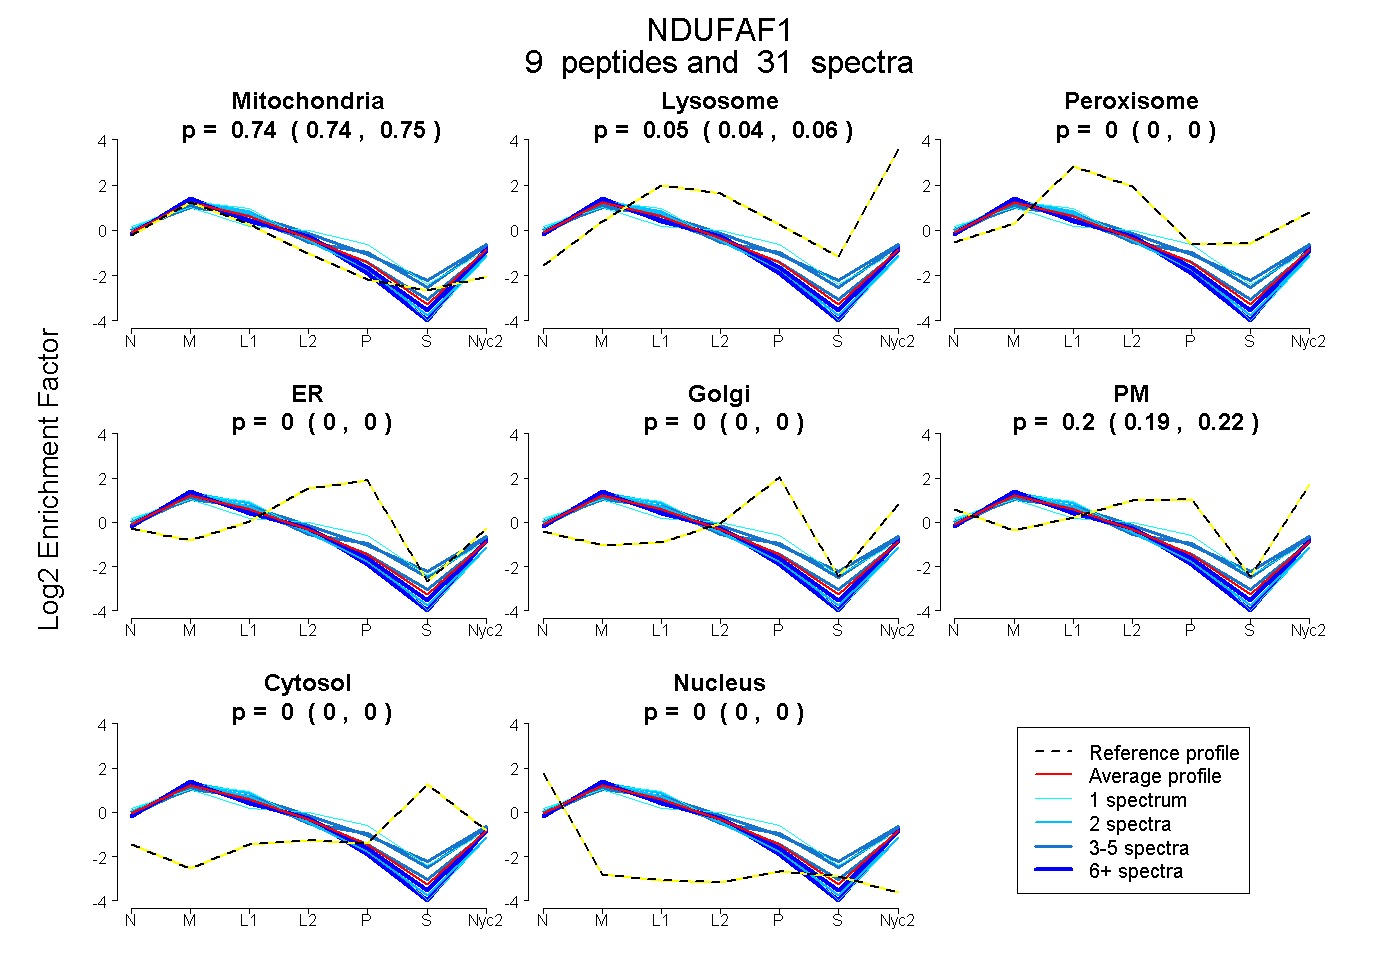
| Expt A |
9 peptides |
31 spectra |
|
0.744 0.738 | 0.749 |
0.052 0.041 | 0.060 |
0.000 0.000 | 0.000 |
0.000 0.000 | 0.000 |
0.000 0.000 | 0.000 |
0.204 0.191 | 0.215 |
0.000 0.000 | 0.000 |
0.000 0.000 | 0.000 |
| 2 spectra, SELFLK | 0.819 | 0.015 | 0.000 | 0.000 | 0.000 | 0.166 | 0.000 | 0.000 | ||
| 1 spectrum, TEEGLQGHDHK | 0.598 | 0.000 | 0.016 | 0.129 | 0.000 | 0.258 | 0.000 | 0.000 | ||
| 7 spectra, FFFSNQGR | 0.793 | 0.034 | 0.000 | 0.000 | 0.000 | 0.173 | 0.000 | 0.000 | ||
| 2 spectra, DVQGPLILDK | 0.817 | 0.000 | 0.000 | 0.000 | 0.000 | 0.182 | 0.000 | 0.000 | ||
| 4 spectra, GPDGRPLHEVIMEQAR | 0.629 | 0.075 | 0.118 | 0.000 | 0.000 | 0.179 | 0.000 | 0.000 | ||
| 1 spectrum, LSYDWSQFNTLYLR | 0.797 | 0.000 | 0.000 | 0.000 | 0.000 | 0.203 | 0.000 | 0.000 | ||
| 7 spectra, VVWQFR | 0.771 | 0.034 | 0.000 | 0.000 | 0.000 | 0.195 | 0.000 | 0.000 | ||
| 3 spectra, EVALDVPSPDR | 0.757 | 0.049 | 0.000 | 0.000 | 0.000 | 0.194 | 0.000 | 0.000 | ||
| 4 spectra, GGPYWQEVK | 0.660 | 0.051 | 0.035 | 0.000 | 0.000 | 0.254 | 0.000 | 0.000 |
| Plot | Mito | Lyso or Perox | ER | Golgi | PM | Cytosol | Nucleus | ||||||
| Expt B |
3 peptides |
8 spectra |
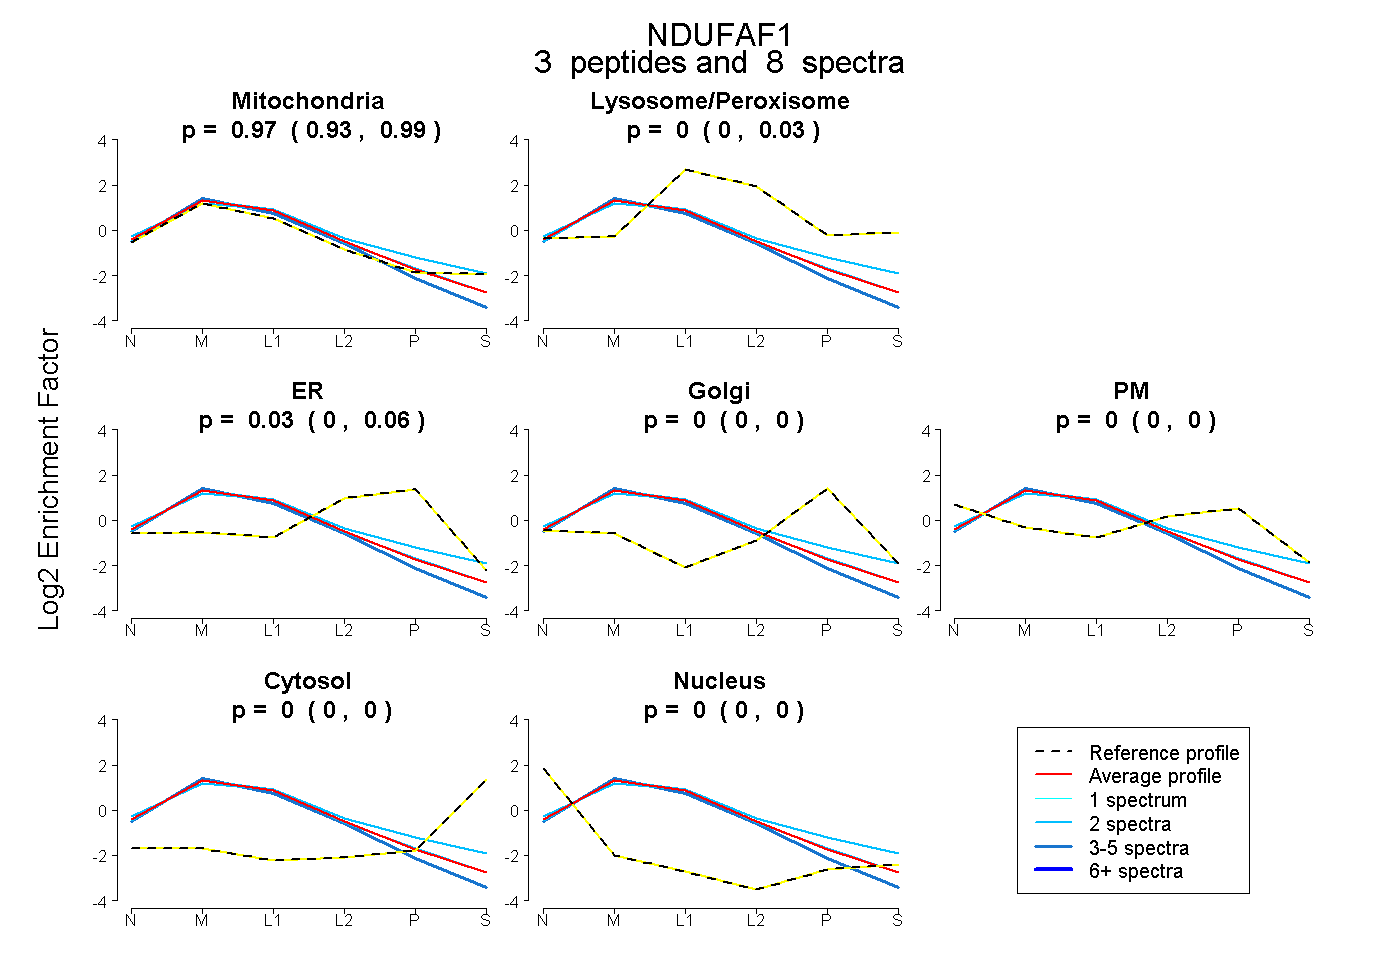 |
0.967 0.931 | 0.992 |
0.000 0.000 | 0.026 |
0.033 0.000 | 0.061 |
0.000 0.000 | 0.000 |
0.000 0.000 | 0.000 |
0.000 0.000 | 0.000 |
0.000 0.000 | 0.000 |
|||
| Plot | Lyso | Other | |||||||||||
| Expt C |
15 peptides |
89 spectra |
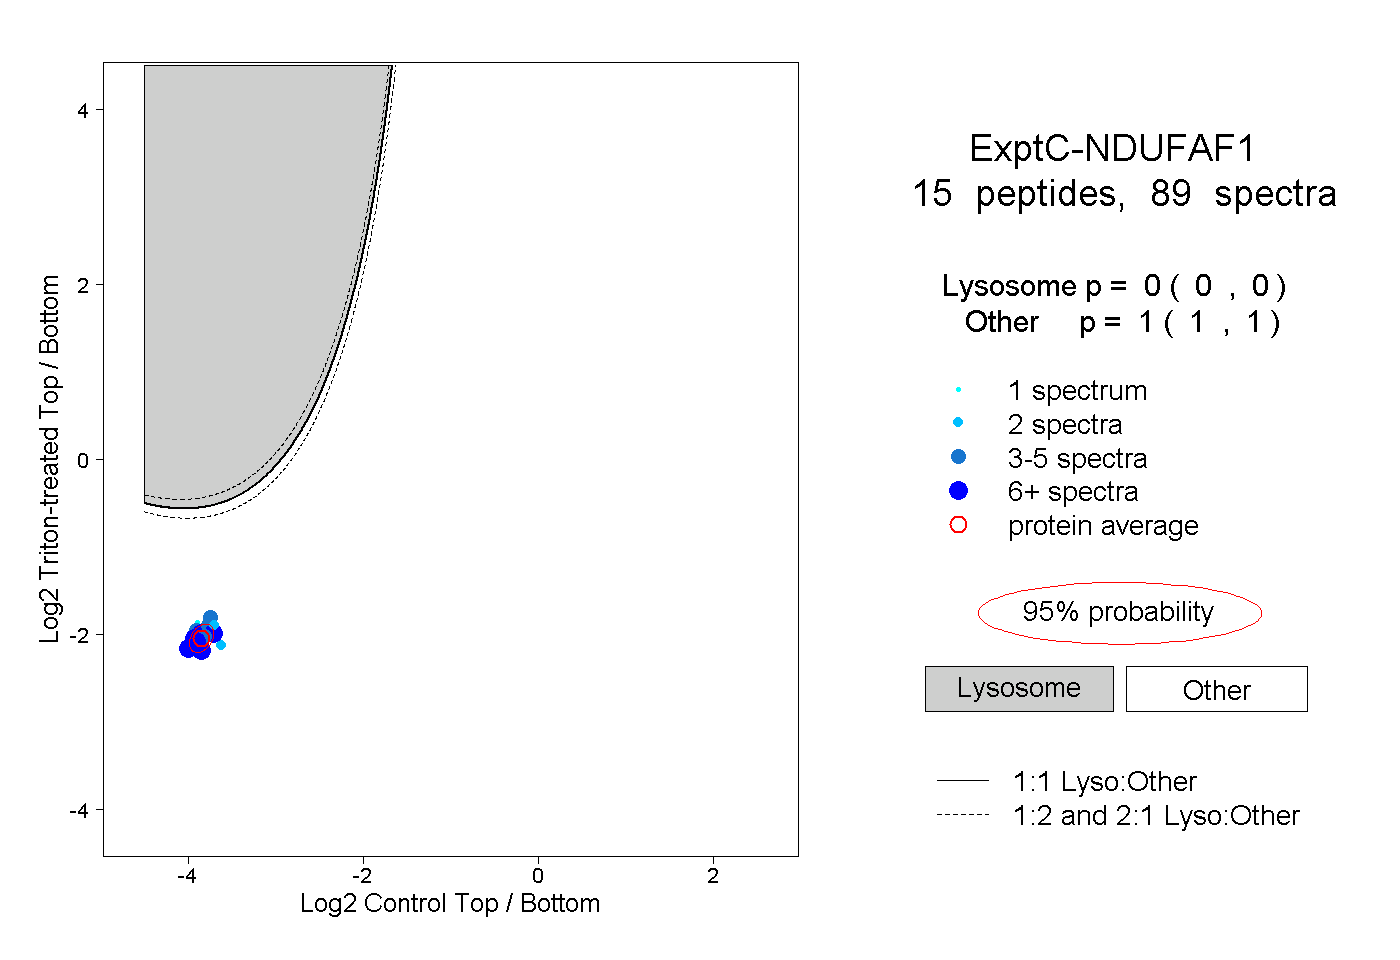 |
0.000 0.000 | 0.000 |
1.000 1.000 | 1.000 |
||||||||
| Plot | Lyso | Other | |||||||||||
| Expt D |
3 peptides |
3 spectra |
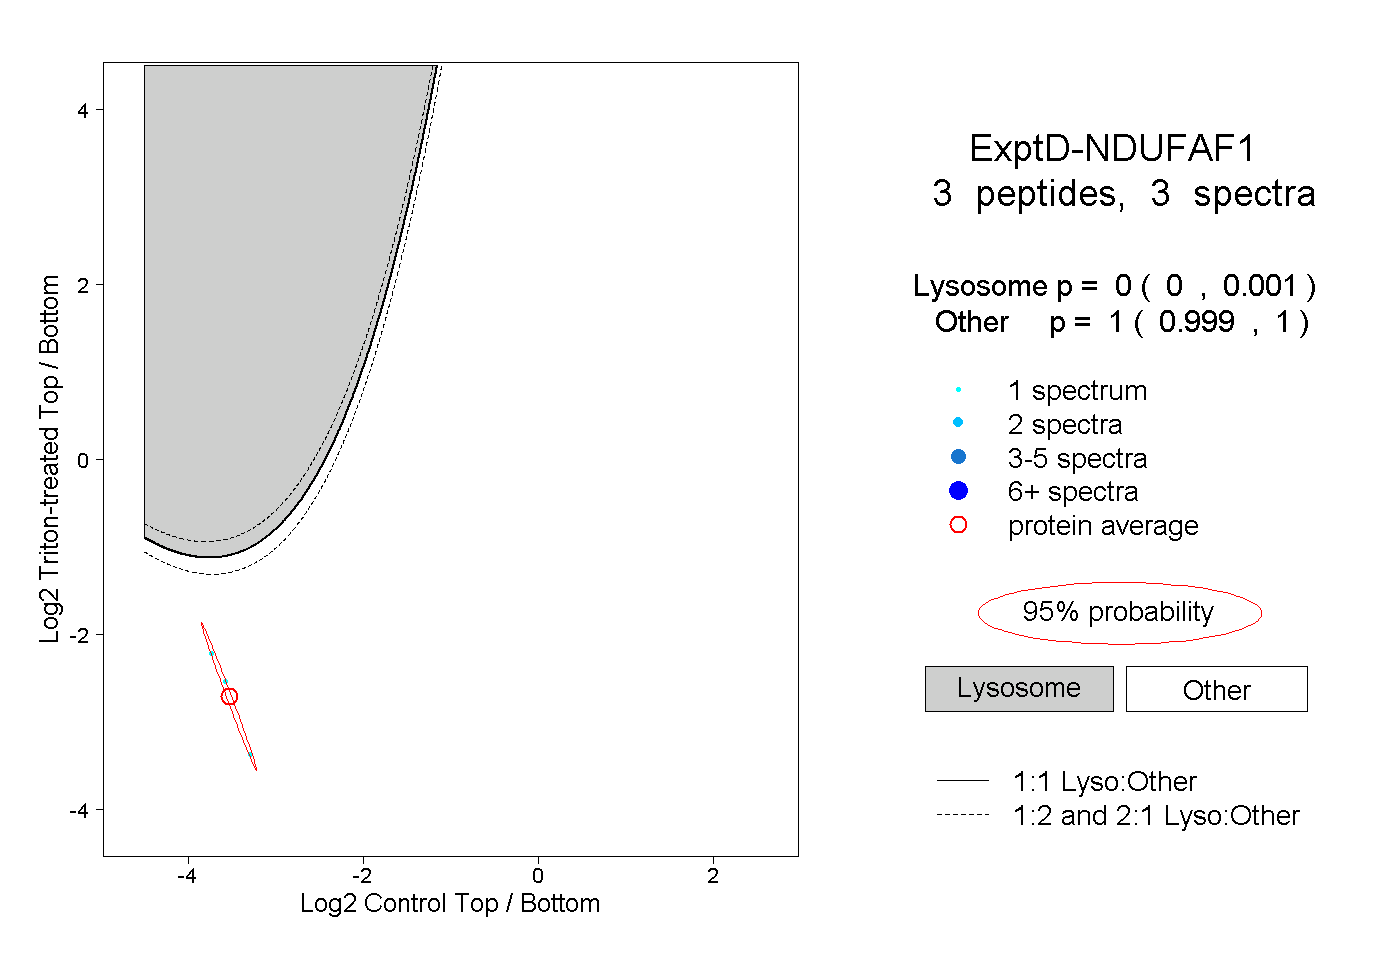 |
0.000 0.000 | 0.001 |
1.000 0.999 | 1.000 |