 14
14peptides
spectra
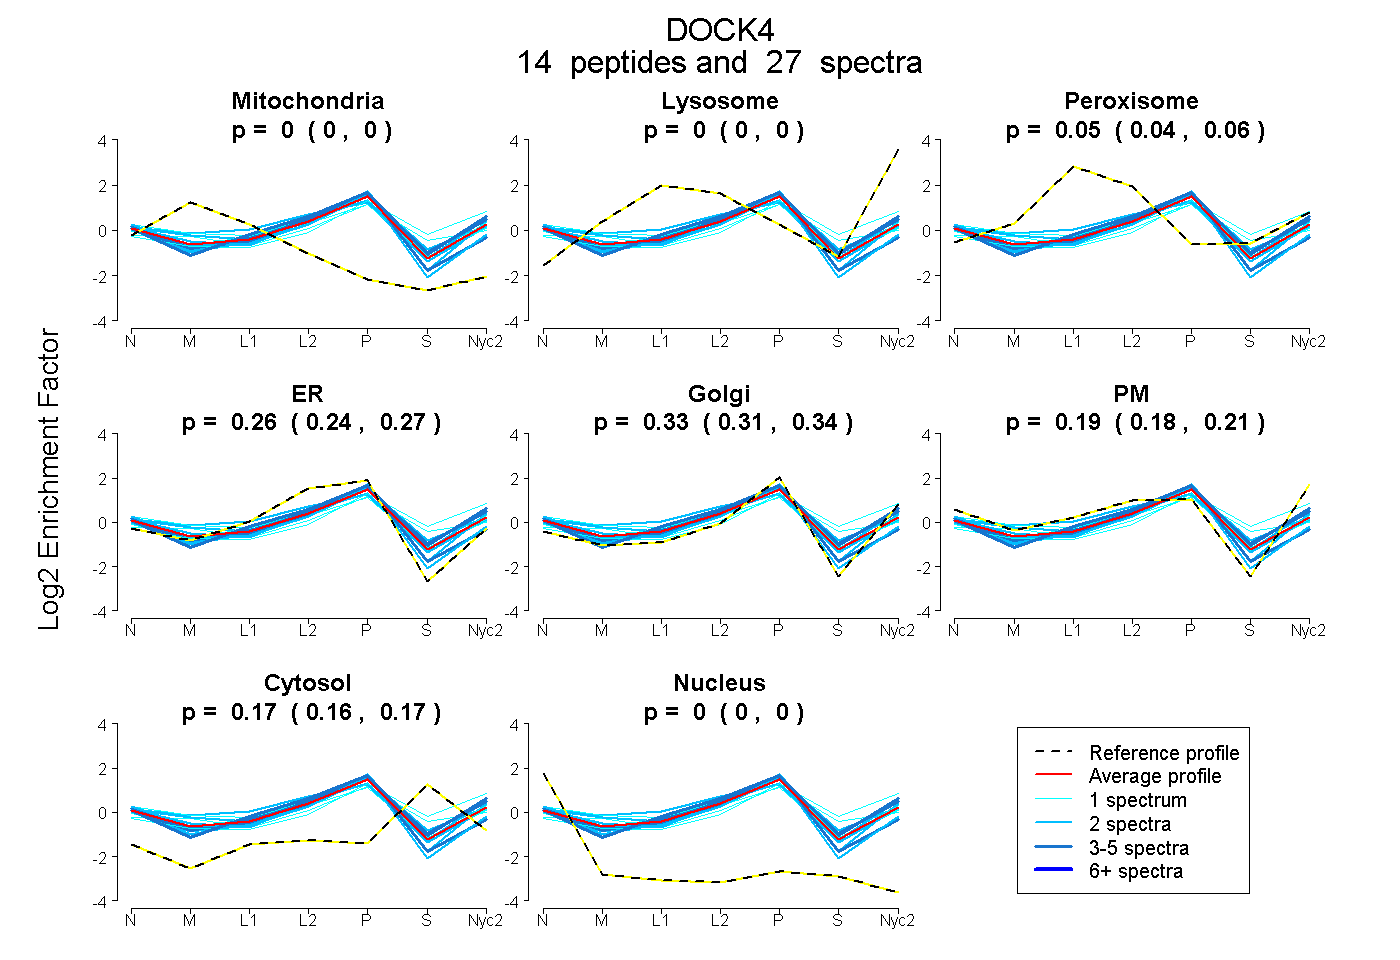
0.000 | 0.000
0.000 | 0.000
0.045 | 0.063
0.241 | 0.274
0.306 | 0.342
0.177 | 0.207
0.161 | 0.173
0.000 | 0.000
1peptide
spectrum
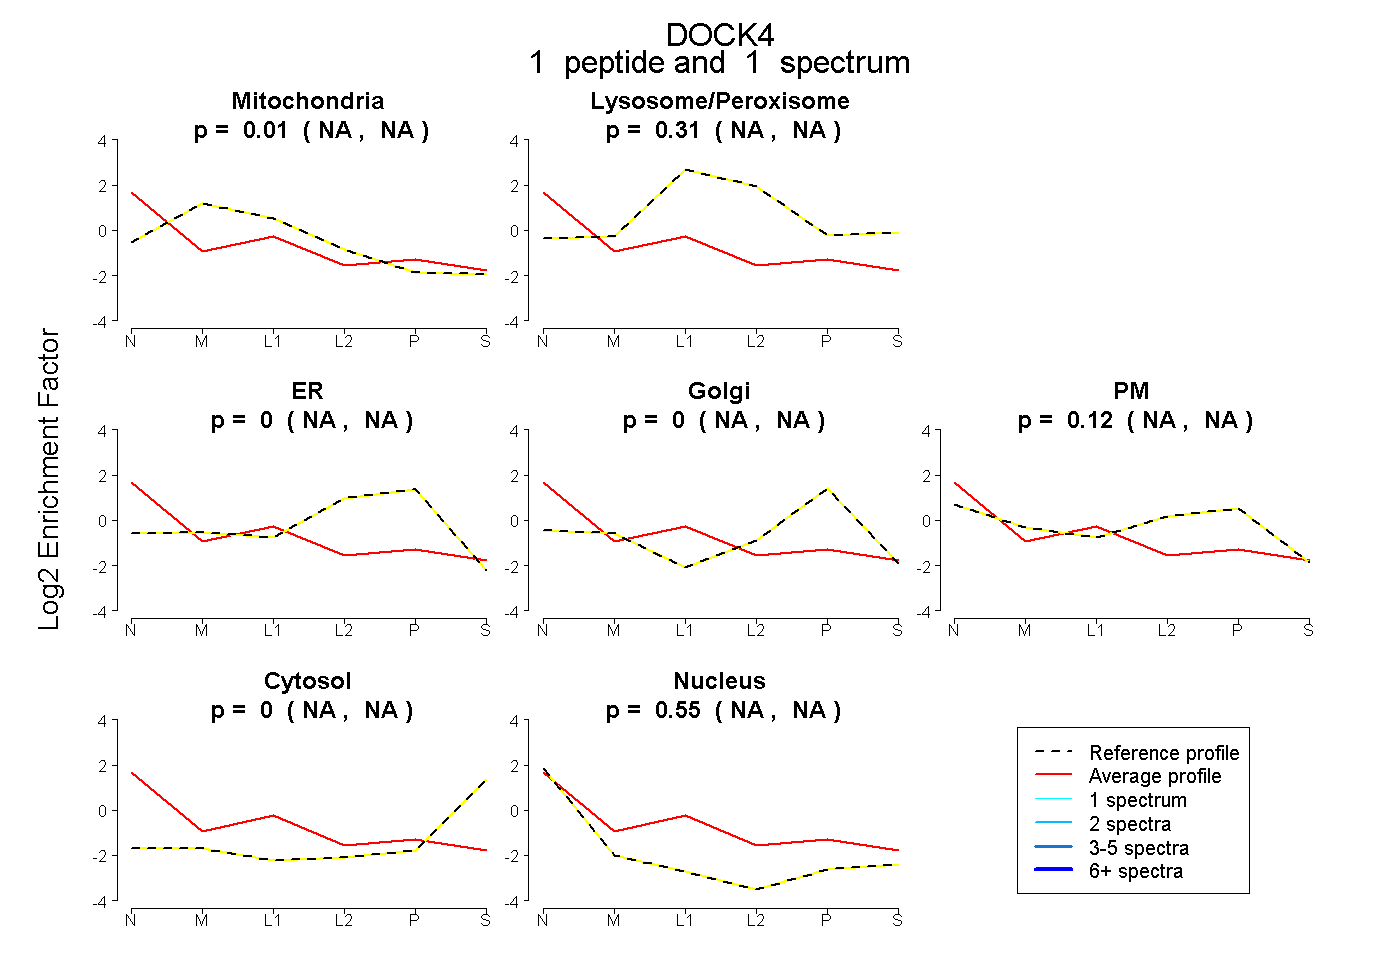
NA | NA
NA | NA
NA | NA
NA | NA
NA | NA
NA | NA
NA | NA
9peptides
spectra
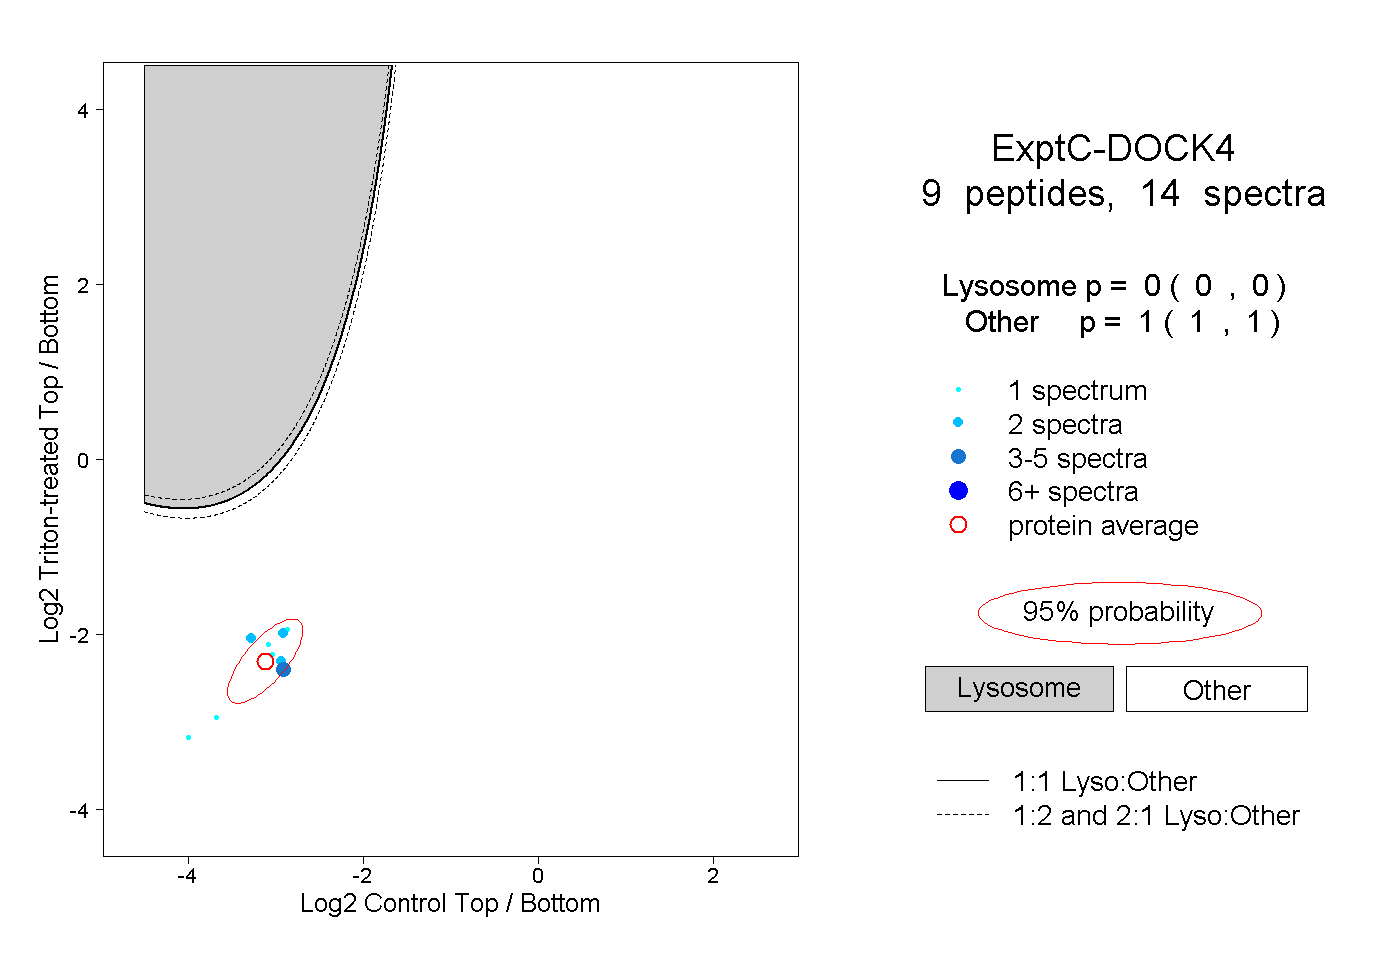
0.000 | 0.000
1.000 | 1.000
3peptides
spectra
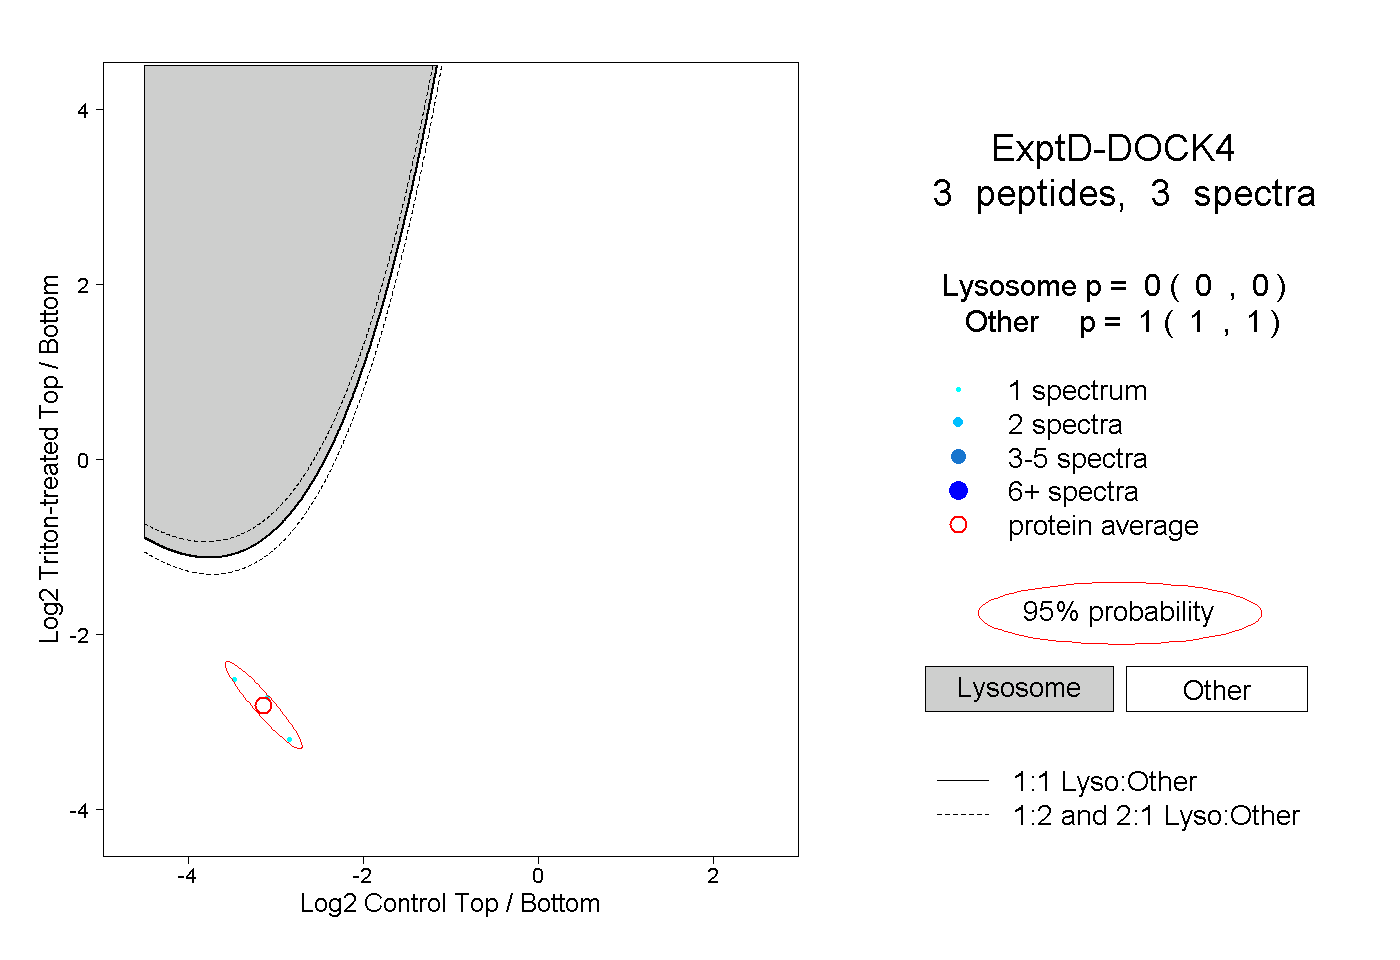
0.000 | 0.000
1.000 | 1.000