 14
14peptides
spectra
0.000 | 0.000
0.000 | 0.000
0.045 | 0.063
0.241 | 0.274
0.306 | 0.342
0.177 | 0.207
0.161 | 0.173
0.000 | 0.000
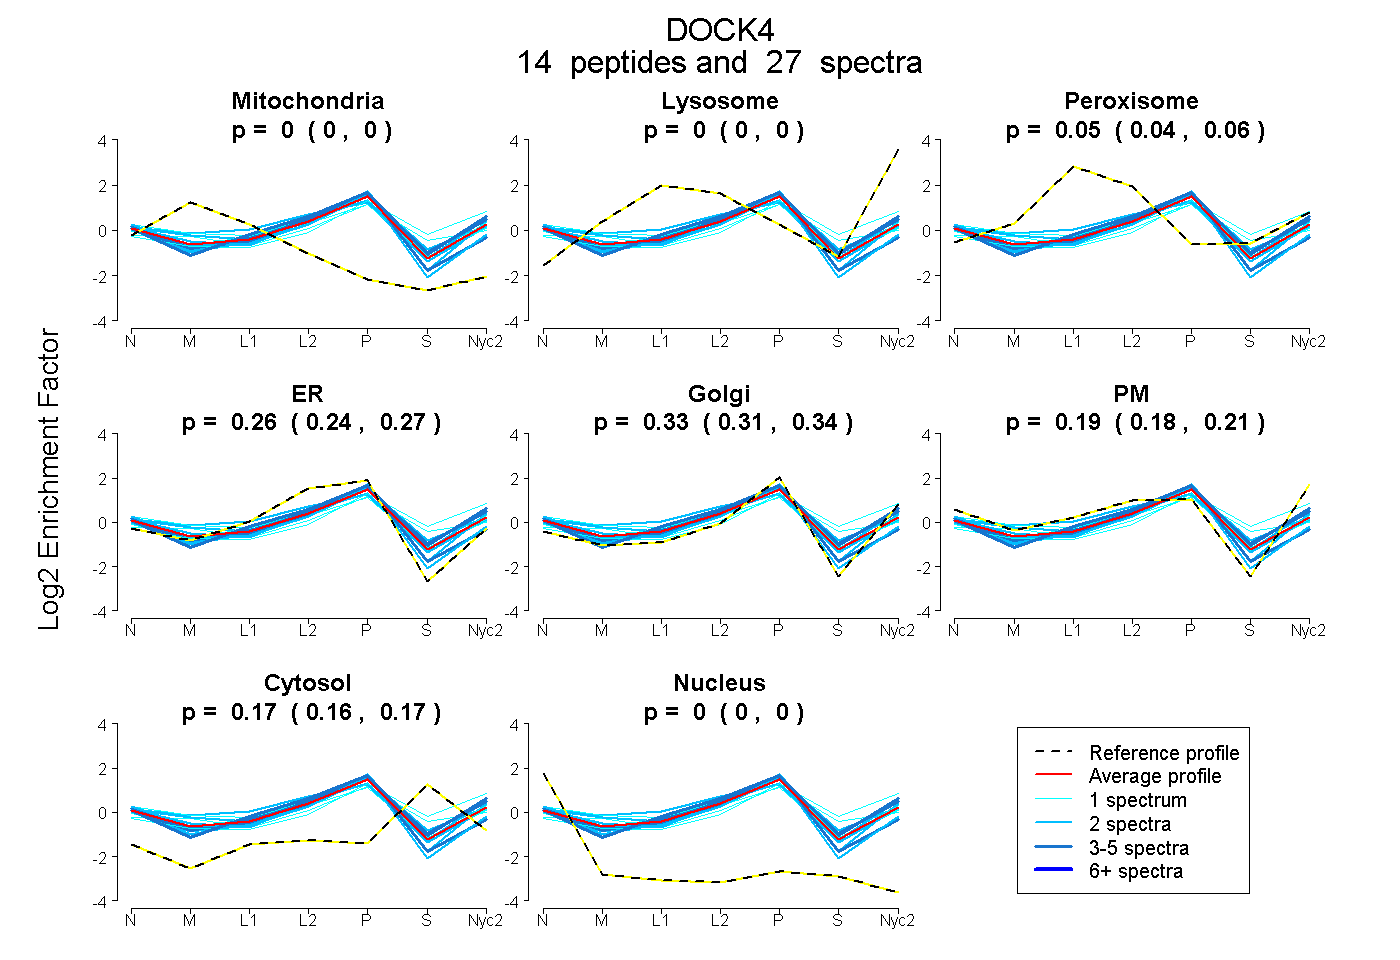
| Plot | Mito | Lyso | Perox | ER | Golgi | PM | Cytosol | Nucleus | |||||
| Expt A |
14 peptides |
27 spectra |
|
0.000 0.000 | 0.000 |
0.000 0.000 | 0.000 |
0.055 0.045 | 0.063 |
0.259 0.241 | 0.274 |
0.325 0.306 | 0.342 |
0.193 0.177 | 0.207 |
0.168 0.161 | 0.173 |
0.000 0.000 | 0.000 |
| 1 spectrum, LEAFQQR | 0.090 | 0.000 | 0.093 | 0.164 | 0.277 | 0.239 | 0.138 | 0.000 | ||
| 2 spectra, AQEYIFK | 0.000 | 0.000 | 0.031 | 0.235 | 0.334 | 0.166 | 0.235 | 0.000 | ||
| 2 spectra, ILIRPEMFPK | 0.000 | 0.000 | 0.014 | 0.354 | 0.344 | 0.106 | 0.183 | 0.000 | ||
| 2 spectra, TLPDGTHELIVHK | 0.042 | 0.000 | 0.000 | 0.381 | 0.409 | 0.078 | 0.023 | 0.067 | ||
| 4 spectra, TILEITSRPQASSSAMR | 0.000 | 0.000 | 0.102 | 0.123 | 0.432 | 0.175 | 0.168 | 0.000 | ||
| 2 spectra, LYDLHLK | 0.017 | 0.000 | 0.000 | 0.246 | 0.406 | 0.241 | 0.090 | 0.000 | ||
| 3 spectra, WSELIK | 0.000 | 0.000 | 0.088 | 0.190 | 0.365 | 0.207 | 0.150 | 0.000 | ||
| 1 spectrum, EGVPDNIK | 0.025 | 0.000 | 0.163 | 0.064 | 0.501 | 0.000 | 0.247 | 0.000 | ||
| 3 spectra, TLISQCQSR | 0.007 | 0.000 | 0.000 | 0.549 | 0.245 | 0.058 | 0.096 | 0.045 | ||
| 2 spectra, FFLSQESK | 0.011 | 0.000 | 0.084 | 0.134 | 0.308 | 0.329 | 0.133 | 0.000 | ||
| 1 spectrum, WFEVEK | 0.000 | 0.124 | 0.000 | 0.000 | 0.451 | 0.118 | 0.307 | 0.000 | ||
| 1 spectrum, LDWGNEQLGLDLVPR | 0.000 | 0.000 | 0.045 | 0.347 | 0.249 | 0.173 | 0.187 | 0.000 | ||
| 1 spectrum, NEGDLFHR | 0.000 | 0.000 | 0.139 | 0.225 | 0.503 | 0.029 | 0.104 | 0.000 | ||
| 2 spectra, GHDYER | 0.056 | 0.000 | 0.166 | 0.281 | 0.243 | 0.173 | 0.081 | 0.000 |
| Plot | Mito | Lyso or Perox | ER | Golgi | PM | Cytosol | Nucleus | ||||||
| Expt B |
1 peptide |
1 spectrum |
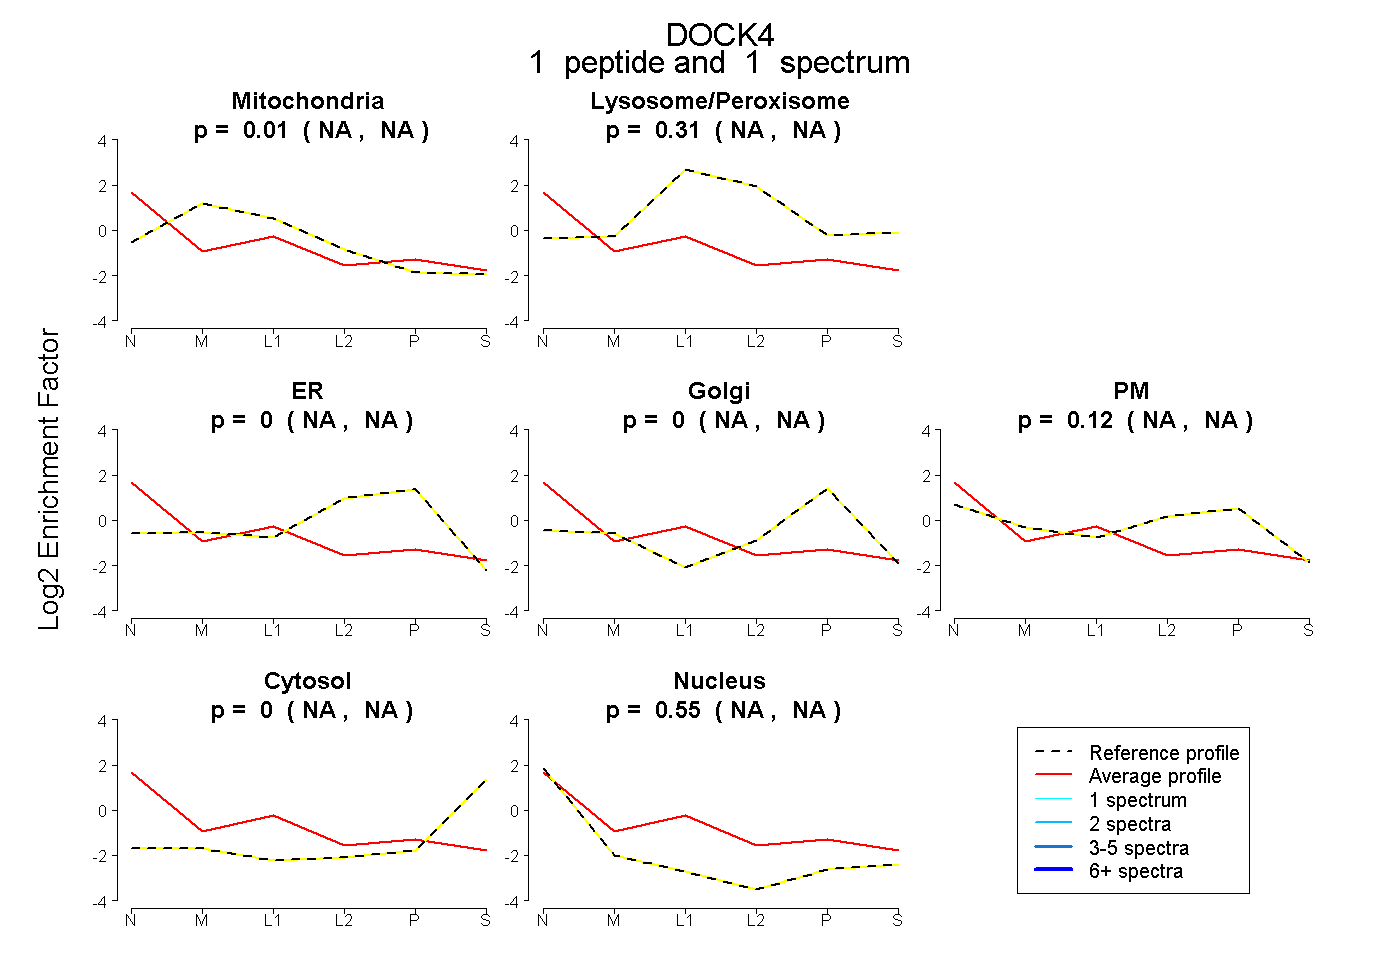 |
0.014 NA | NA |
0.314 NA | NA |
0.000 NA | NA |
0.000 NA | NA |
0.124 NA | NA |
0.000 NA | NA |
0.548 NA | NA |
|||
| Plot | Lyso | Other | |||||||||||
| Expt C |
9 peptides |
14 spectra |
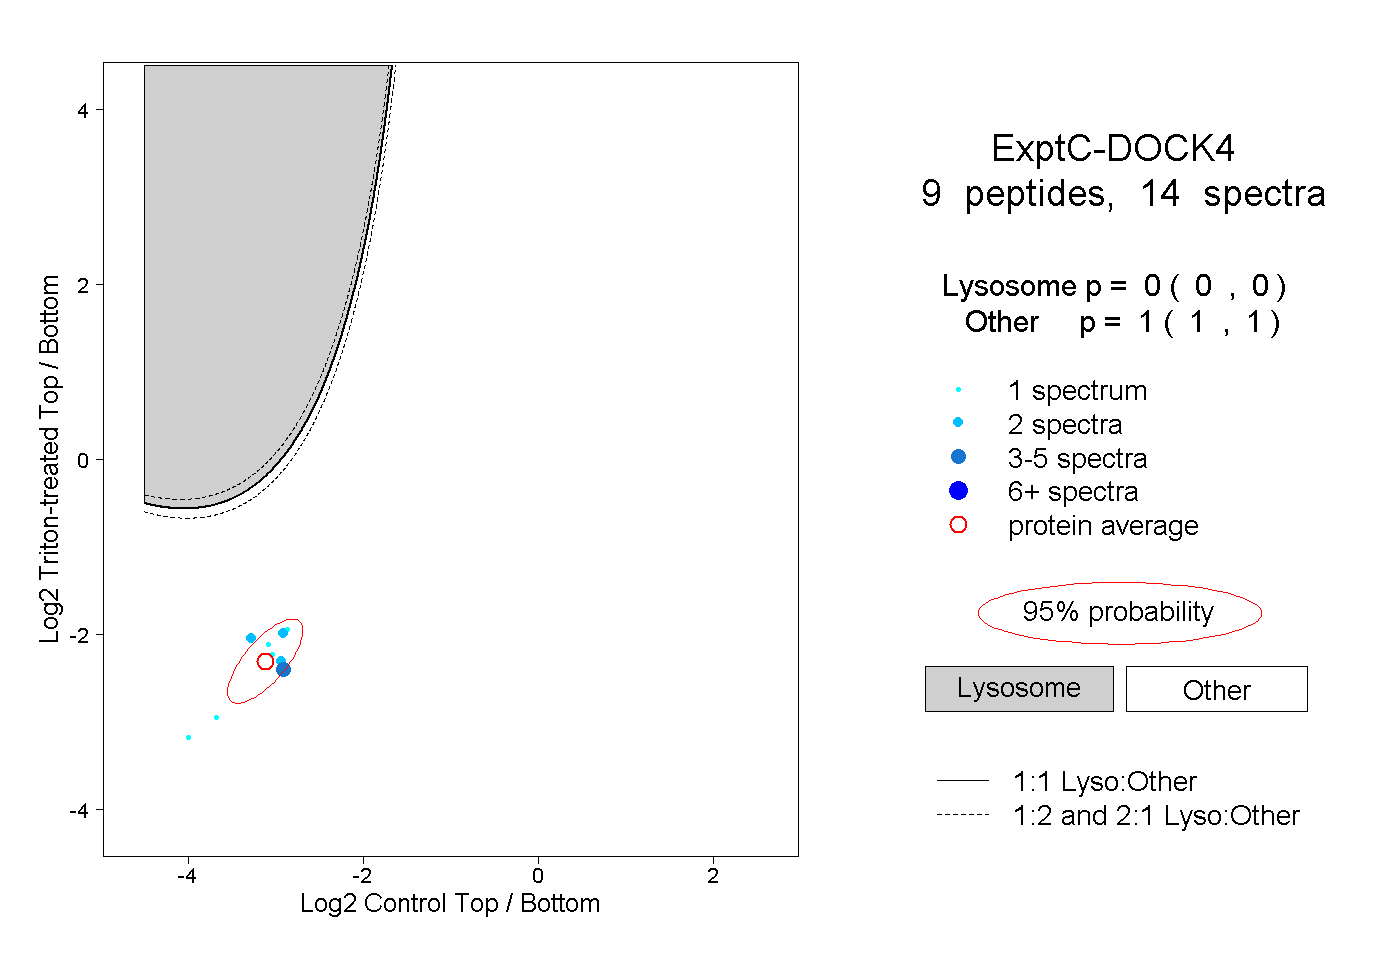 |
0.000 0.000 | 0.000 |
1.000 1.000 | 1.000 |
||||||||
| Plot | Lyso | Other | |||||||||||
| Expt D |
3 peptides |
3 spectra |
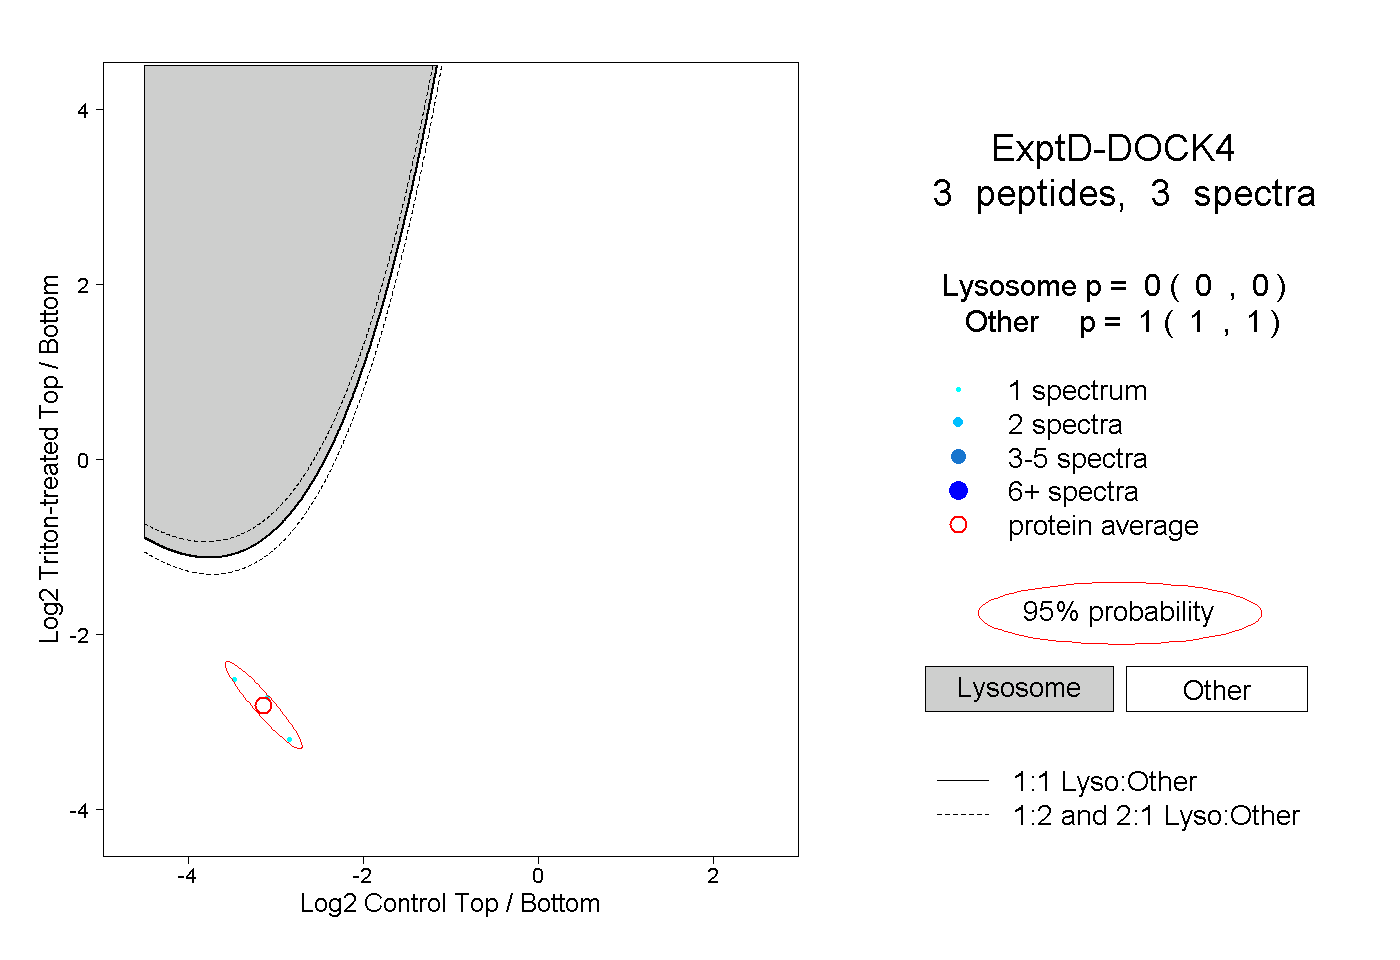 |
0.000 0.000 | 0.000 |
1.000 1.000 | 1.000 |