 15
15peptides
spectra
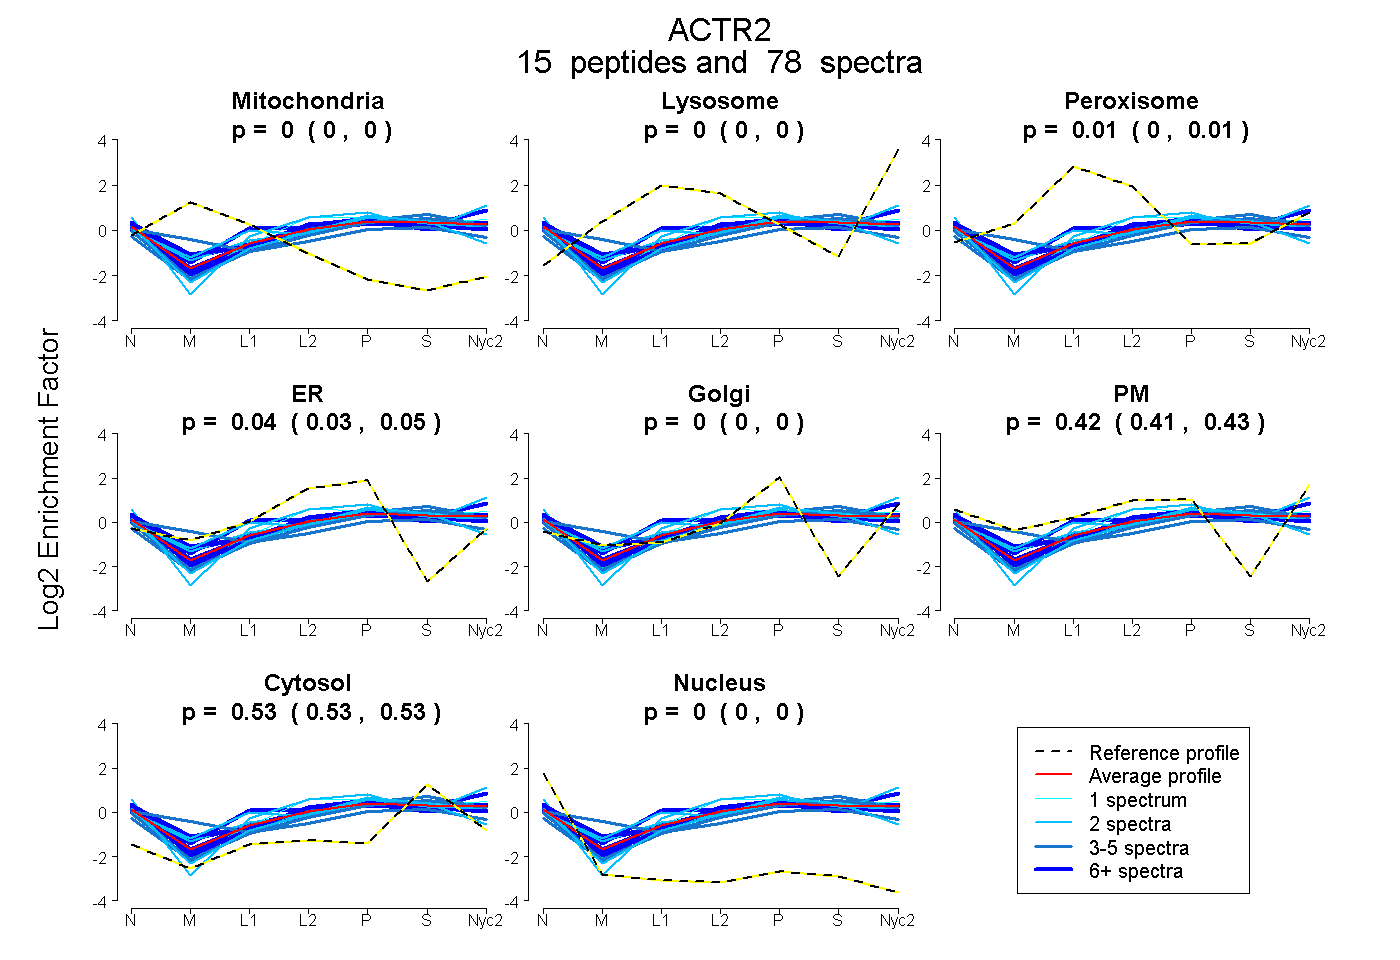
0.000 | 0.000
0.000 | 0.000
0.005 | 0.013
0.034 | 0.046
0.000 | 0.000
0.414 | 0.429
0.525 | 0.530
0.000 | 0.000
6peptides
spectra
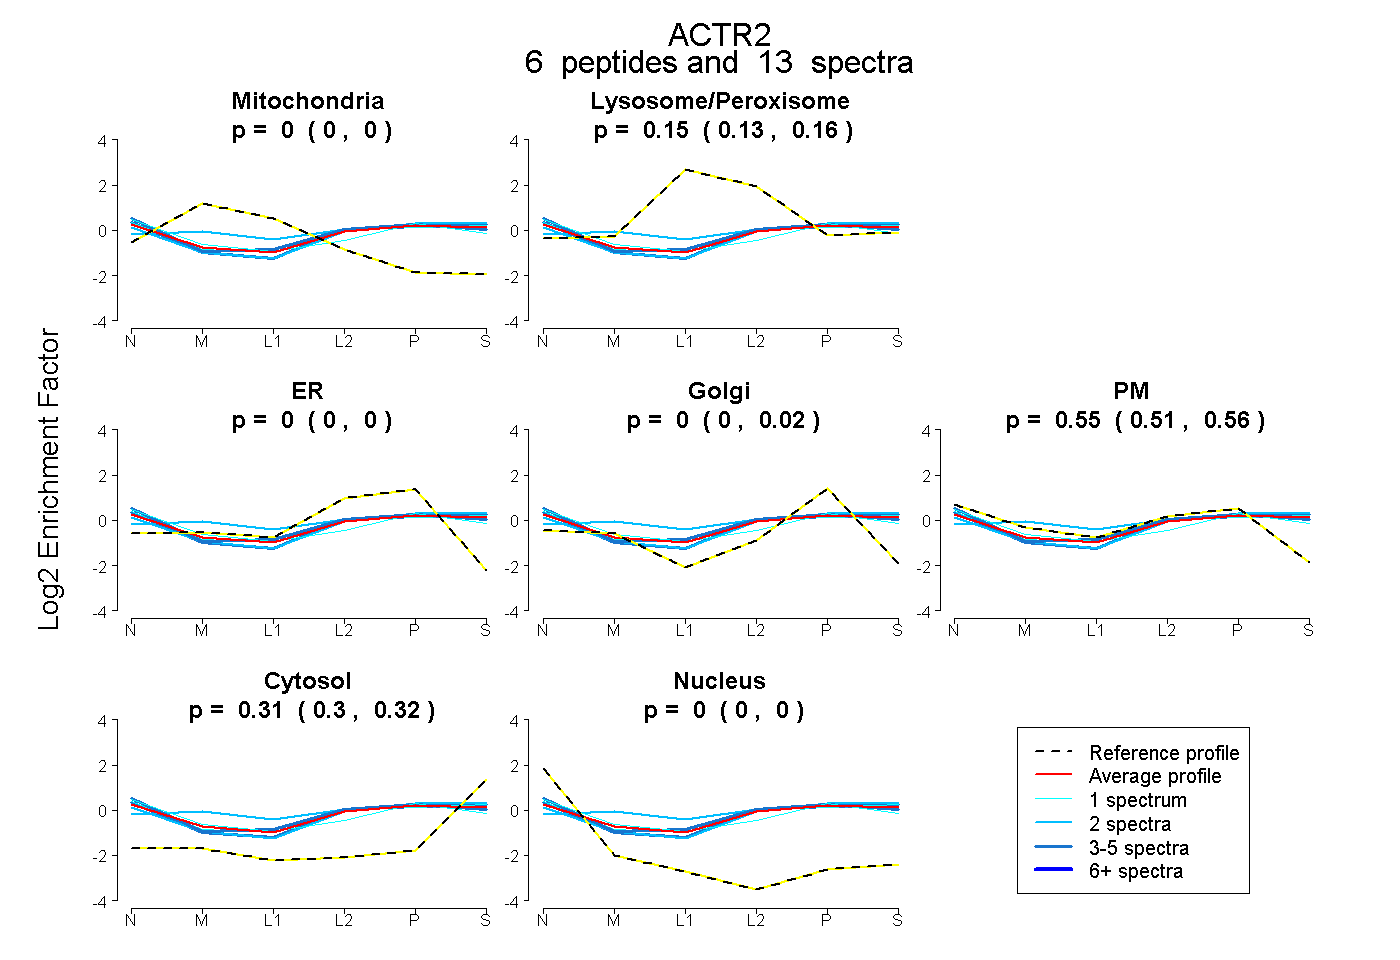
0.000 | 0.000
0.130 | 0.161
0.000 | 0.000
0.000 | 0.020
0.509 | 0.559
0.300 | 0.315
0.000 | 0.000
15peptides
spectra
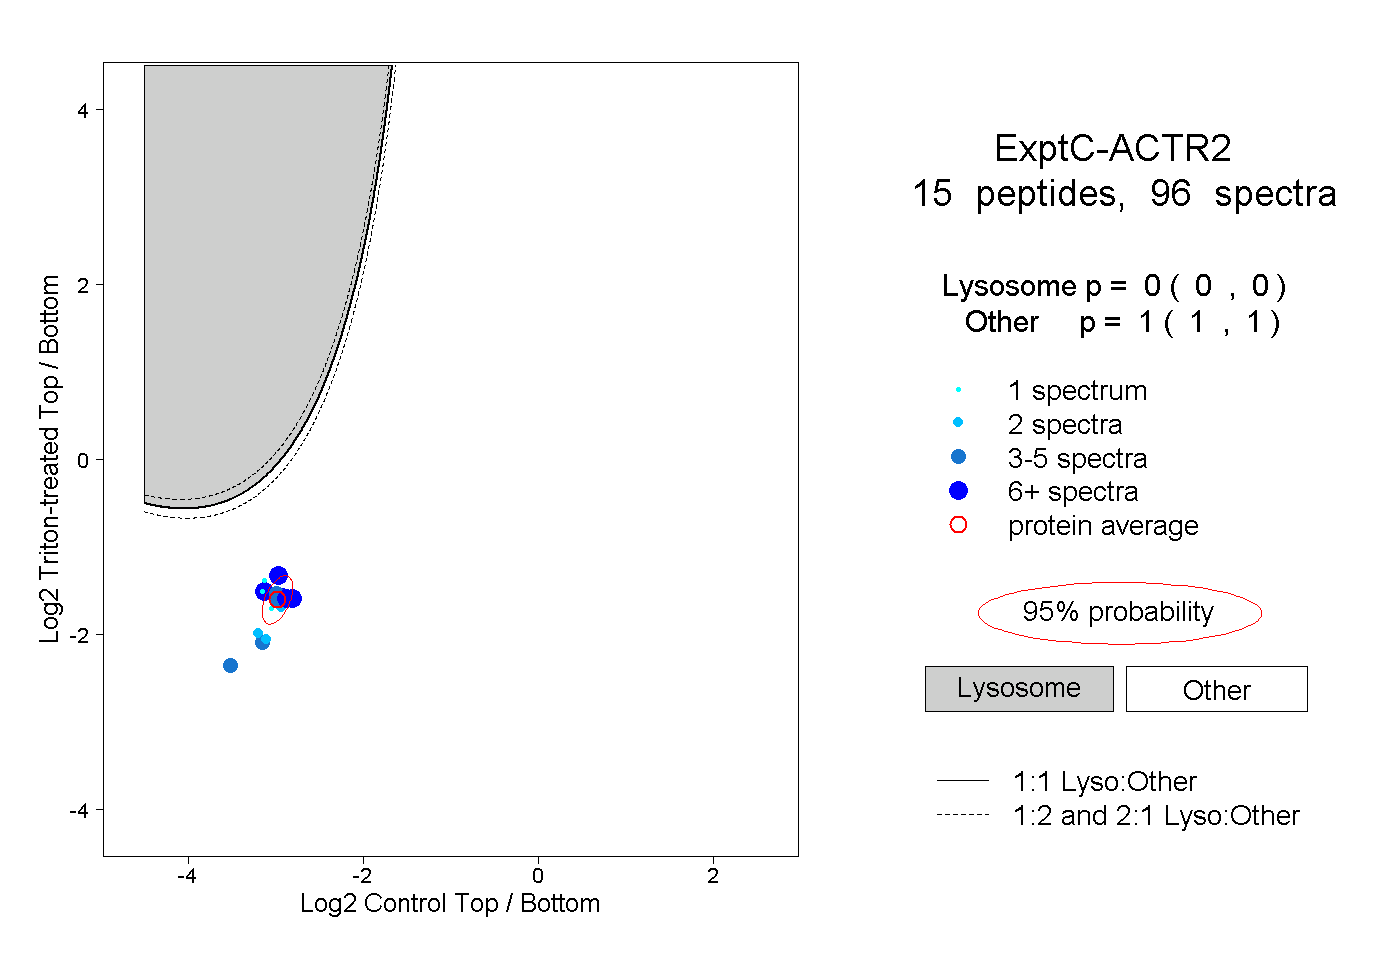
0.000 | 0.000
1.000 | 1.000
6peptides
spectra
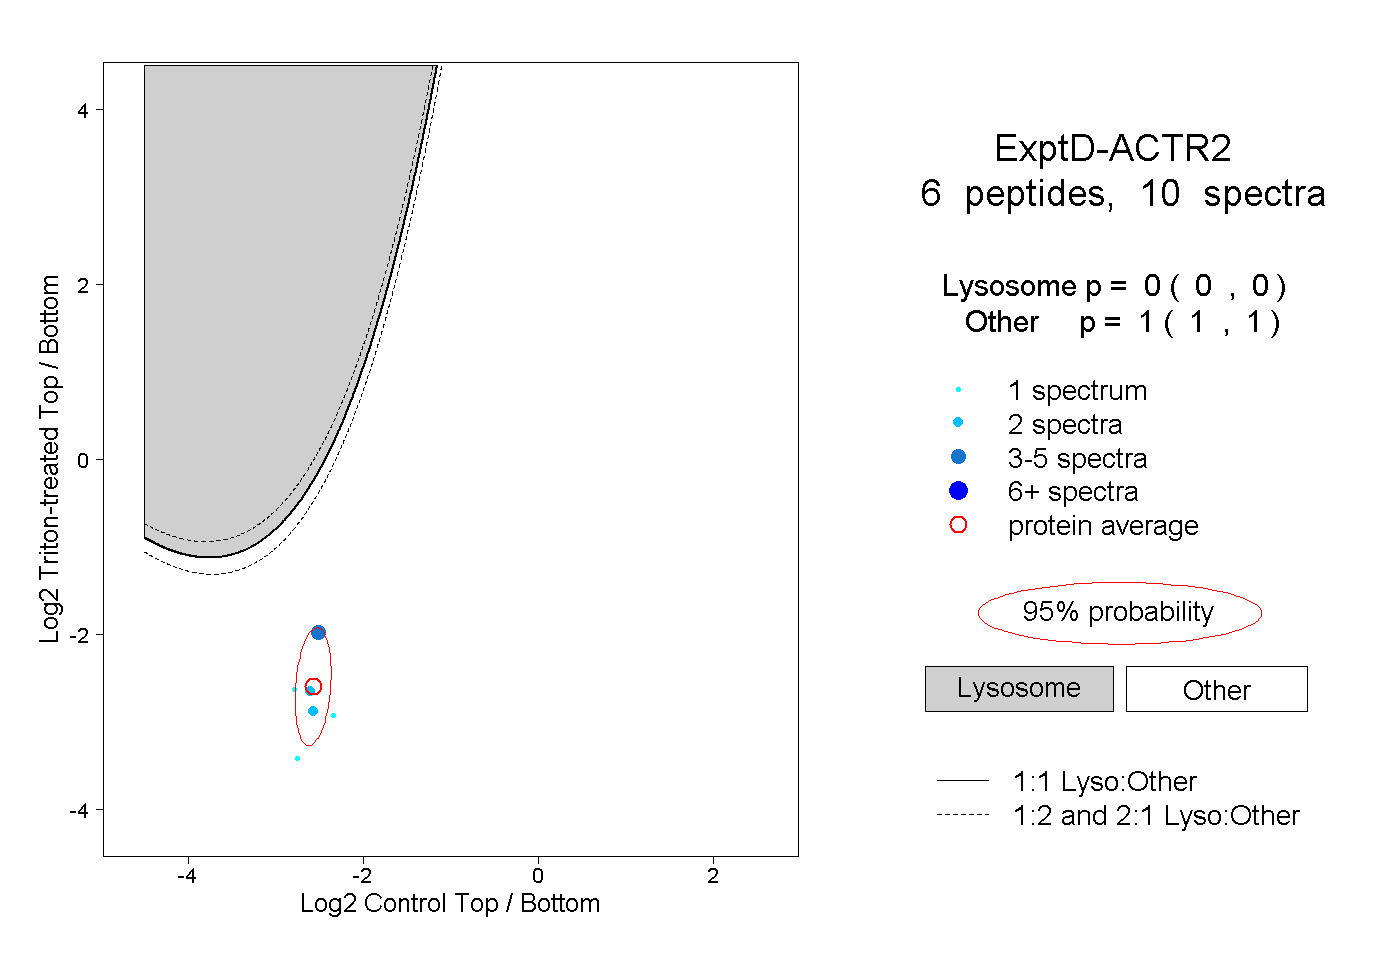
0.000 | 0.000
1.000 | 1.000