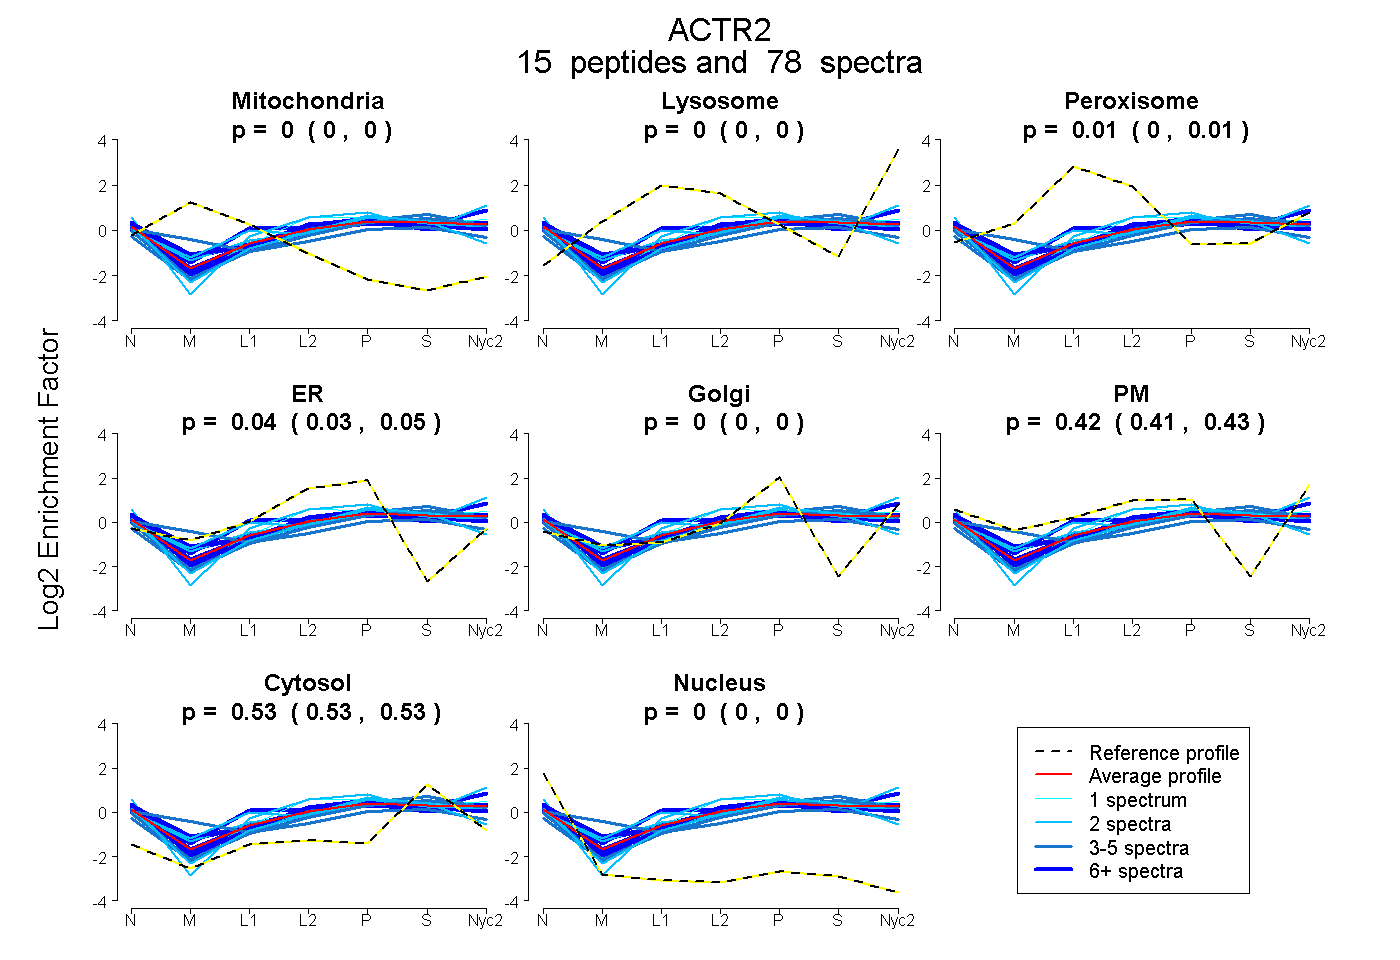
 15
15peptides
spectra
0.000 | 0.000
0.000 | 0.000
0.005 | 0.013
0.034 | 0.046
0.000 | 0.000
0.414 | 0.429
0.525 | 0.530
0.000 | 0.000
| Plot | Mito | Lyso | Perox | ER | Golgi | PM | Cytosol | Nucleus | |||||
| Expt A |
15 peptides |
78 spectra |
|
0.000 0.000 | 0.000 |
0.000 0.000 | 0.000 |
0.009 0.005 | 0.013 |
0.040 0.034 | 0.046 |
0.000 0.000 | 0.000 |
0.422 0.414 | 0.429 |
0.528 0.525 | 0.530 |
0.000 0.000 | 0.000 |
| 6 spectra, NWDDMK | 0.000 | 0.000 | 0.009 | 0.023 | 0.000 | 0.513 | 0.455 | 0.000 | ||
| 2 spectra, LCYVGYNIEQEQK | 0.000 | 0.000 | 0.075 | 0.000 | 0.035 | 0.377 | 0.512 | 0.000 | ||
| 2 spectra, SMLEVNYPMENGIVR | 0.000 | 0.000 | 0.218 | 0.000 | 0.229 | 0.138 | 0.415 | 0.000 | ||
| 6 spectra, HIVLSGGSTMYPGLPSR | 0.000 | 0.024 | 0.124 | 0.000 | 0.000 | 0.429 | 0.423 | 0.000 | ||
| 2 spectra, LGVTVR | 0.000 | 0.000 | 0.000 | 0.000 | 0.000 | 0.570 | 0.430 | 0.000 | ||
| 3 spectra, QLYLER | 0.138 | 0.000 | 0.000 | 0.000 | 0.058 | 0.325 | 0.478 | 0.000 | ||
| 7 spectra, GYAFNHSADFETVR | 0.000 | 0.000 | 0.012 | 0.058 | 0.000 | 0.400 | 0.529 | 0.000 | ||
| 6 spectra, HLWDYTFGPEK | 0.000 | 0.000 | 0.026 | 0.000 | 0.007 | 0.456 | 0.511 | 0.000 | ||
| 2 spectra, VVVCDNGTGFVK | 0.000 | 0.000 | 0.000 | 0.337 | 0.026 | 0.054 | 0.583 | 0.000 | ||
| 5 spectra, HMVFLGGAVLADIMK | 0.000 | 0.000 | 0.000 | 0.080 | 0.037 | 0.274 | 0.609 | 0.000 | ||
| 5 spectra, ILLTEPPMNPTK | 0.000 | 0.000 | 0.000 | 0.067 | 0.000 | 0.373 | 0.560 | 0.000 | ||
| 7 spectra, QEYQEK | 0.000 | 0.000 | 0.000 | 0.153 | 0.000 | 0.327 | 0.520 | 0.000 | ||
| 21 spectra, DLMVGDEASELR | 0.000 | 0.000 | 0.011 | 0.000 | 0.000 | 0.433 | 0.556 | 0.000 | ||
| 3 spectra, VGNIEIK | 0.000 | 0.000 | 0.000 | 0.000 | 0.086 | 0.311 | 0.603 | 0.000 | ||
| 1 spectrum, LALETTVLVESYTLPDGR | 0.000 | 0.000 | 0.002 | 0.070 | 0.000 | 0.443 | 0.486 | 0.000 |
| Plot | Mito | Lyso or Perox | ER | Golgi | PM | Cytosol | Nucleus | ||||||
| Expt B |
6 peptides |
13 spectra |
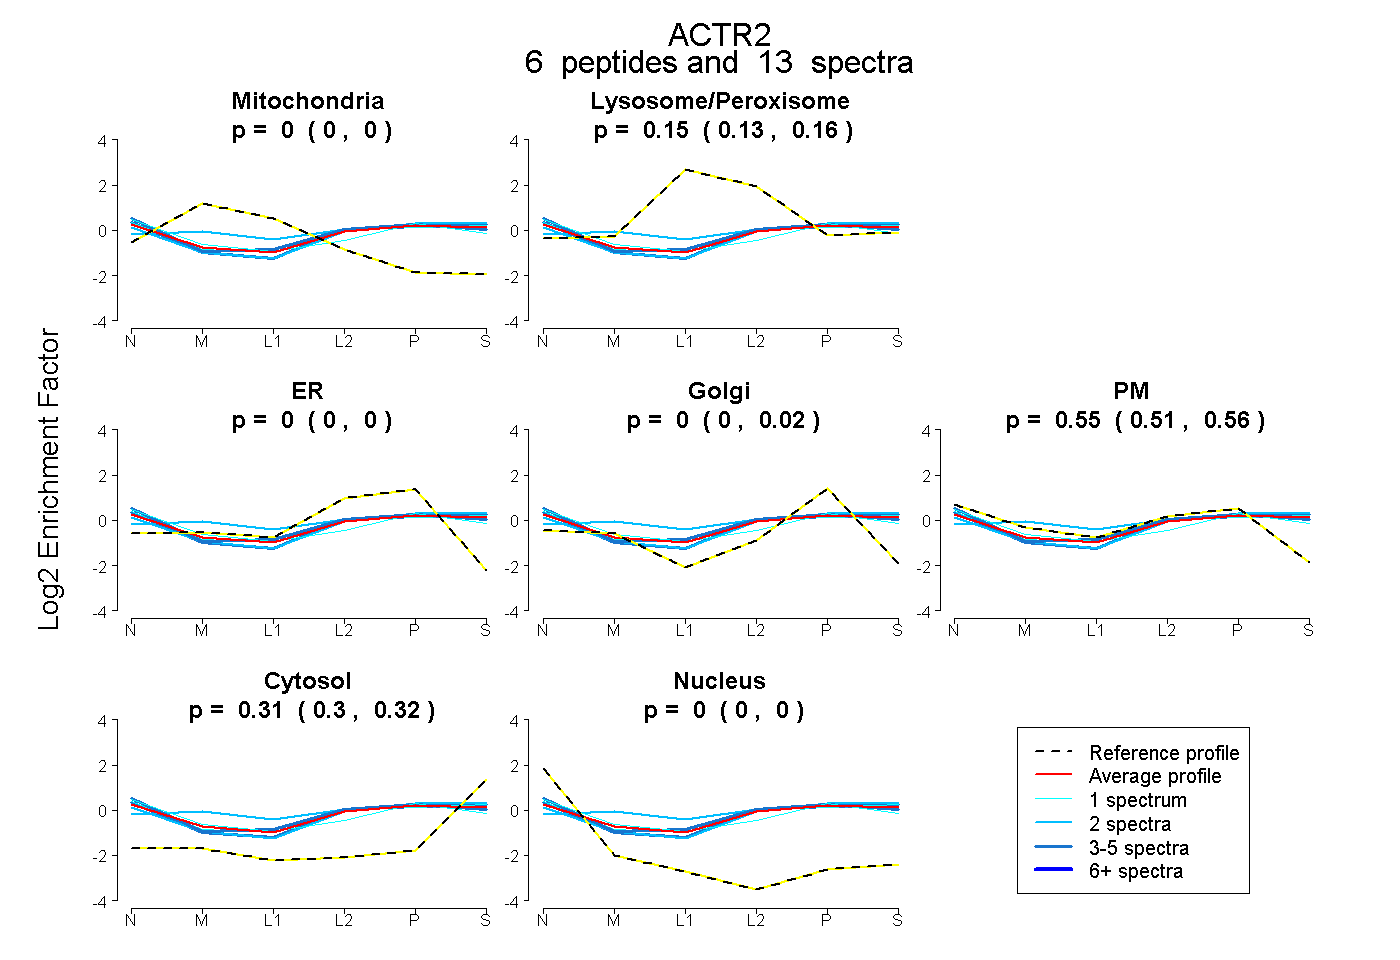 |
0.000 0.000 | 0.000 |
0.145 0.130 | 0.161 |
0.000 0.000 | 0.000 |
0.000 0.000 | 0.020 |
0.546 0.509 | 0.559 |
0.309 0.300 | 0.315 |
0.000 0.000 | 0.000 |
|||
| Plot | Lyso | Other | |||||||||||
| Expt C |
15 peptides |
96 spectra |
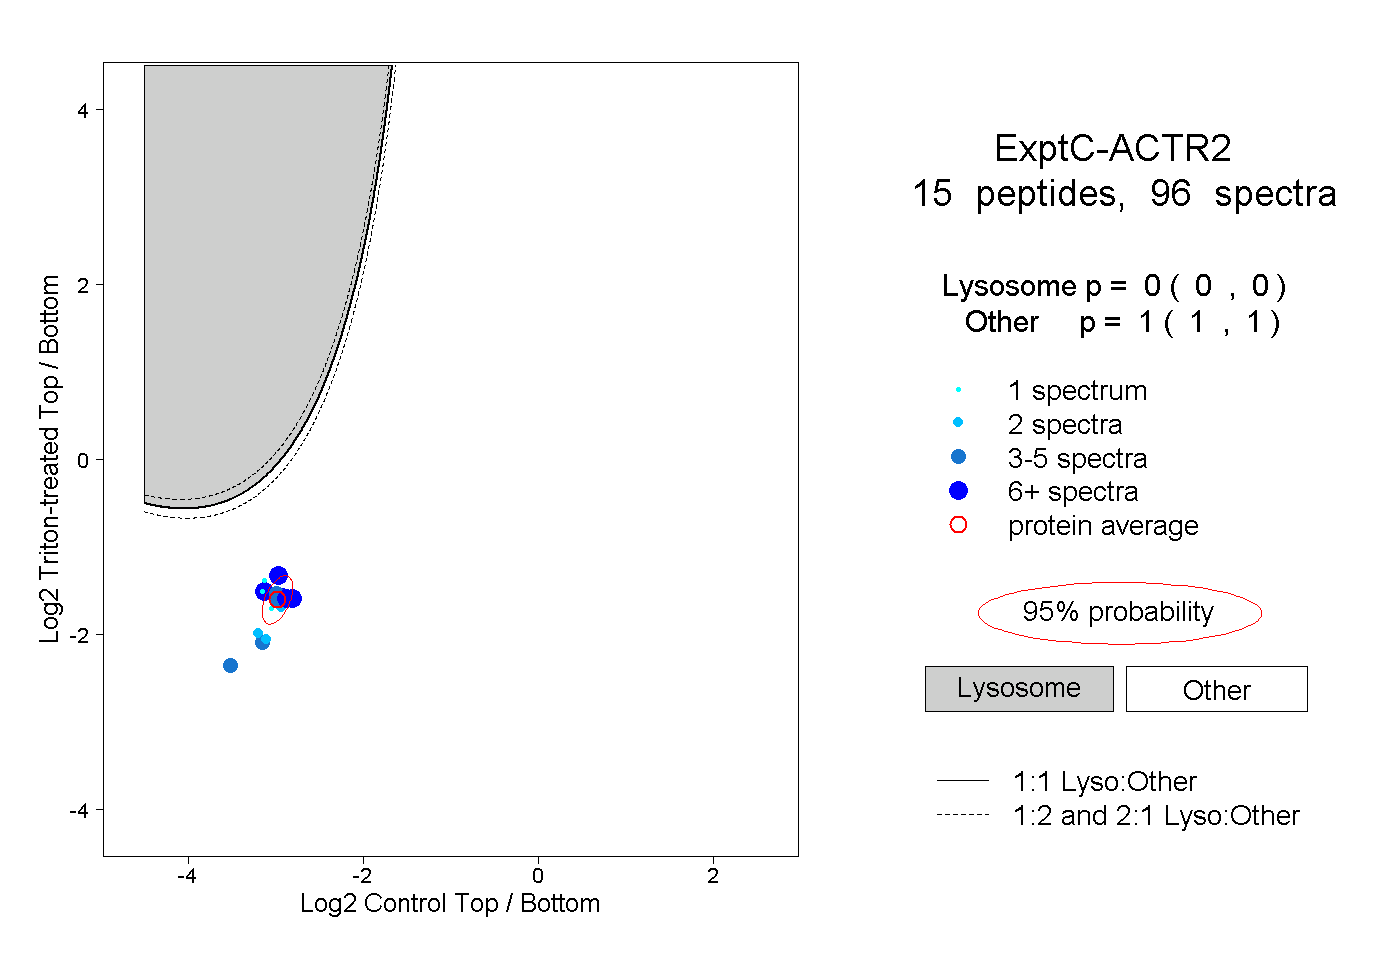 |
0.000 0.000 | 0.000 |
1.000 1.000 | 1.000 |
||||||||
| Plot | Lyso | Other | |||||||||||
| Expt D |
6 peptides |
10 spectra |
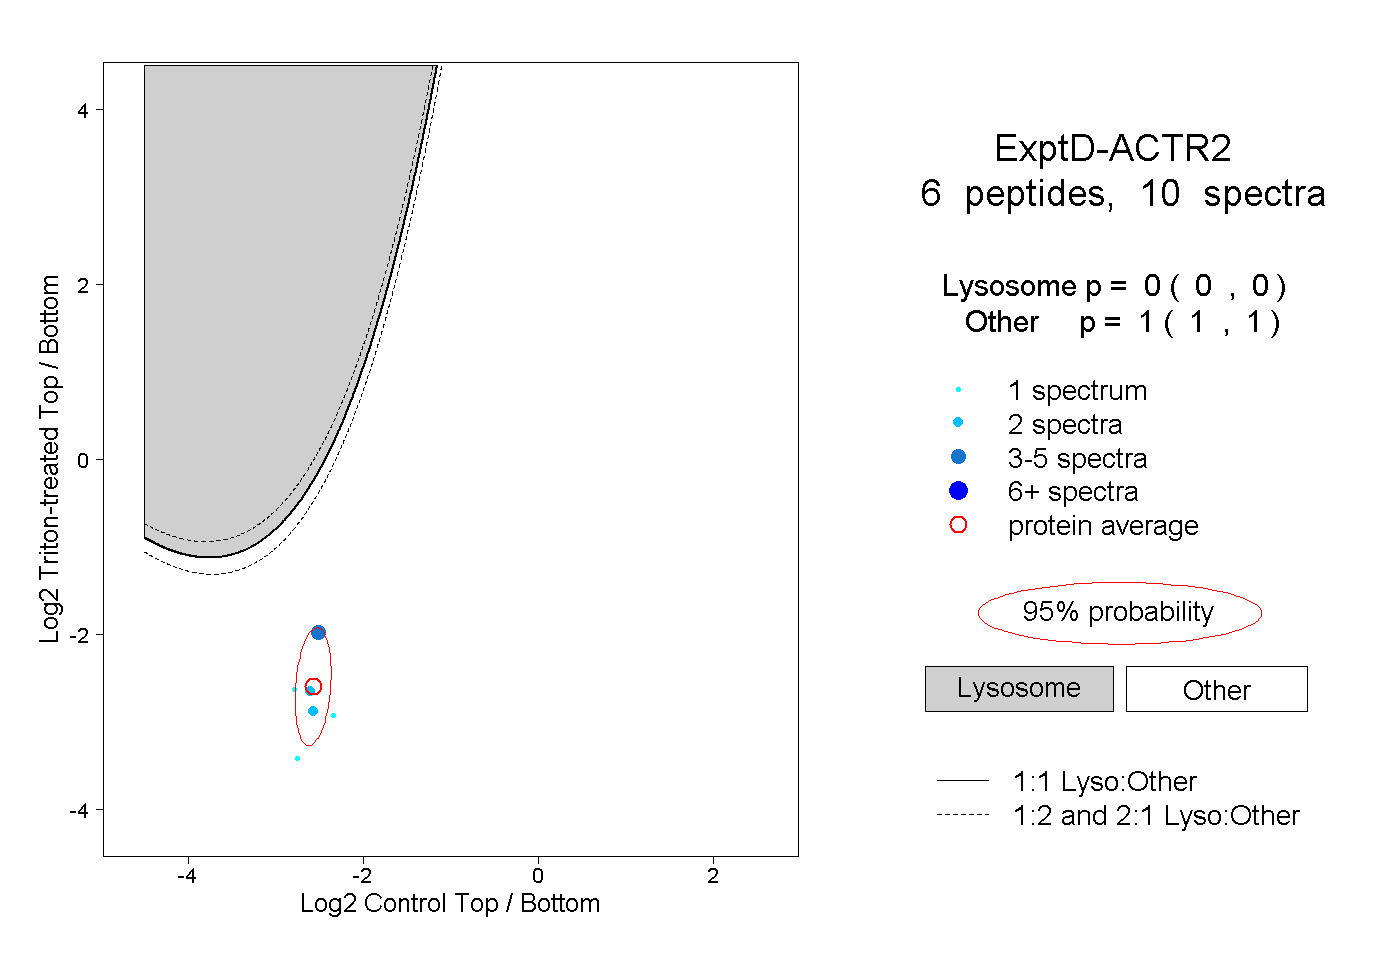 |
0.000 0.000 | 0.000 |
1.000 1.000 | 1.000 |