 9
9peptides
spectra

0.000 | 0.000
0.000 | 0.000
0.000 | 0.000
0.000 | 0.000
0.262 | 0.316
0.019 | 0.077
0.646 | 0.667
0.000 | 0.000
4peptides
spectra

0.000 | 0.000
0.093 | 0.277
0.000 | 0.000
0.261 | 0.393
0.000 | 0.133
0.383 | 0.463
0.000 | 0.000
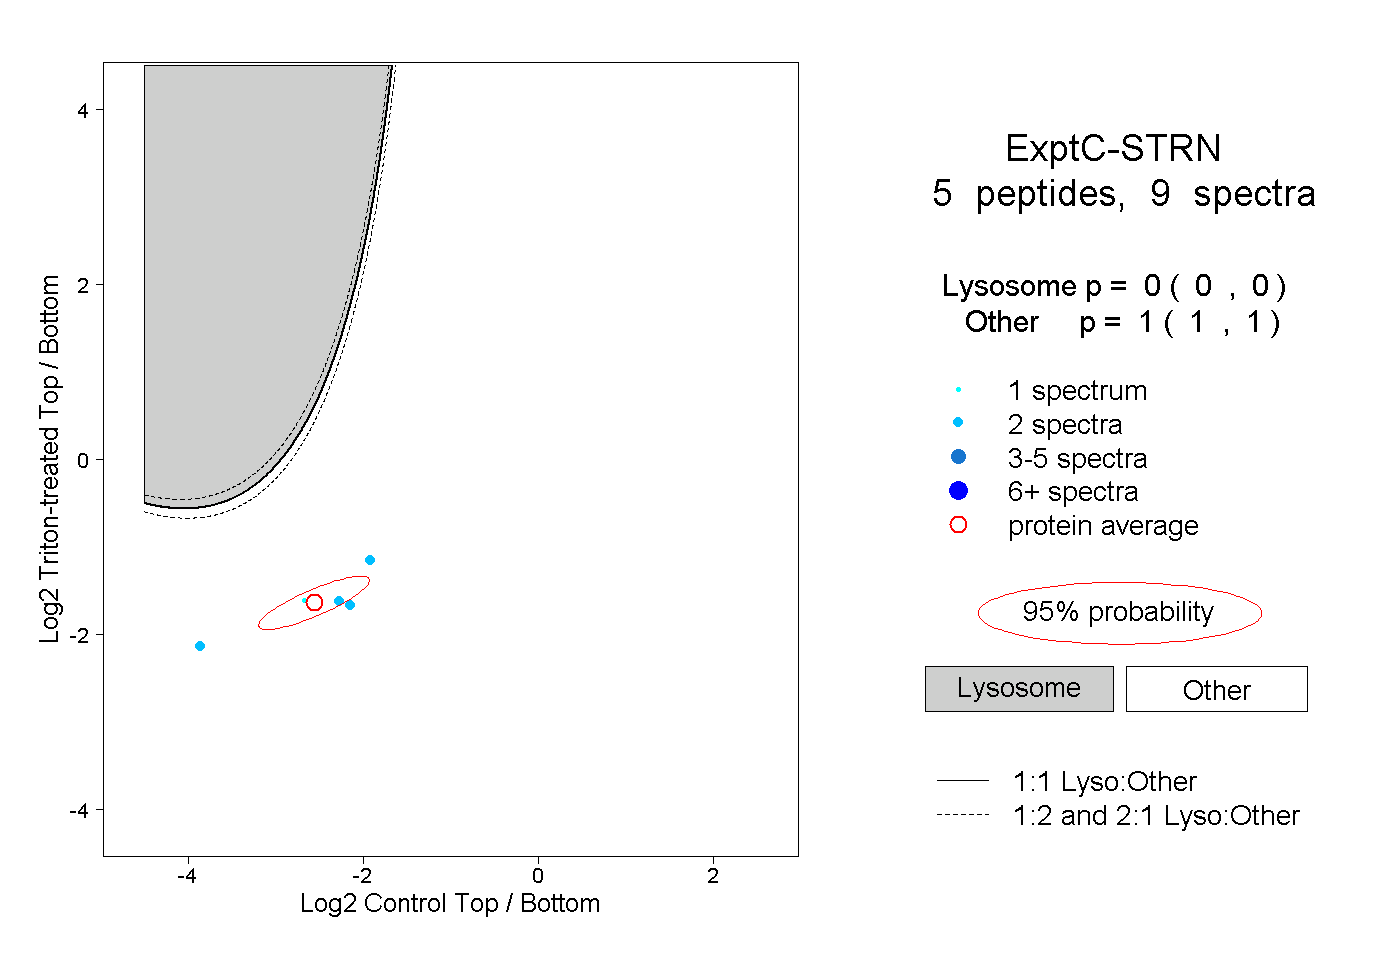
5peptides
spectra
0.000 | 0.000
1.000 | 1.000