STRN
[ENSRNOP00000006527]
Main page
| | | Plot |
Mito |
Lyso |
|
Perox |
ER |
Golgi |
PM |
Cytosol |
Nucleus |
|
| Expt A |
 9
9
peptides |
16
spectra |
 |
0.000
0.000 | 0.000 |
0.000
0.000 | 0.000 |
|
0.000
0.000 | 0.000 |
0.000
0.000 | 0.000 |
0.291
0.262 | 0.316 |
0.051
0.019 | 0.077 |
0.658
0.646 | 0.667 |
0.000
0.000 | 0.000 |
|
| | | Plot |
Mito |
|
Lyso or Perox |
|
ER |
Golgi |
PM |
Cytosol |
Nucleus |
|
| Expt B |
4
peptides |
5
spectra |
 |
0.000
0.000 | 0.000 |
|
0.209
0.093 | 0.277 |
|
0.000
0.000 | 0.000 |
0.368
0.261 | 0.393 |
0.000
0.000 | 0.133 |
0.423
0.383 | 0.463 |
0.000
0.000 | 0.000 |
|
| 1 spectrum, LLSCSADGTLR |
0.000 |
|
0.061 |
|
0.000 |
0.305 |
0.119 |
0.515 |
0.000 |
|
| 1 spectrum, TCIQEFTAHR |
0.000 |
|
0.506 |
|
0.000 |
0.195 |
0.135 |
0.164 |
0.000 |
|
| 2 spectra, SVIDTSTIVR |
0.000 |
|
0.000 |
|
0.000 |
0.358 |
0.076 |
0.565 |
0.000 |
|
| 1 spectrum, SHFDGIR |
0.000 |
|
0.180 |
|
0.004 |
0.343 |
0.000 |
0.473 |
0.000 |
|
| | | Plot |
|
Lyso |
|
|
|
|
|
|
|
Other |
| Expt C |
5
peptides |
9
spectra |
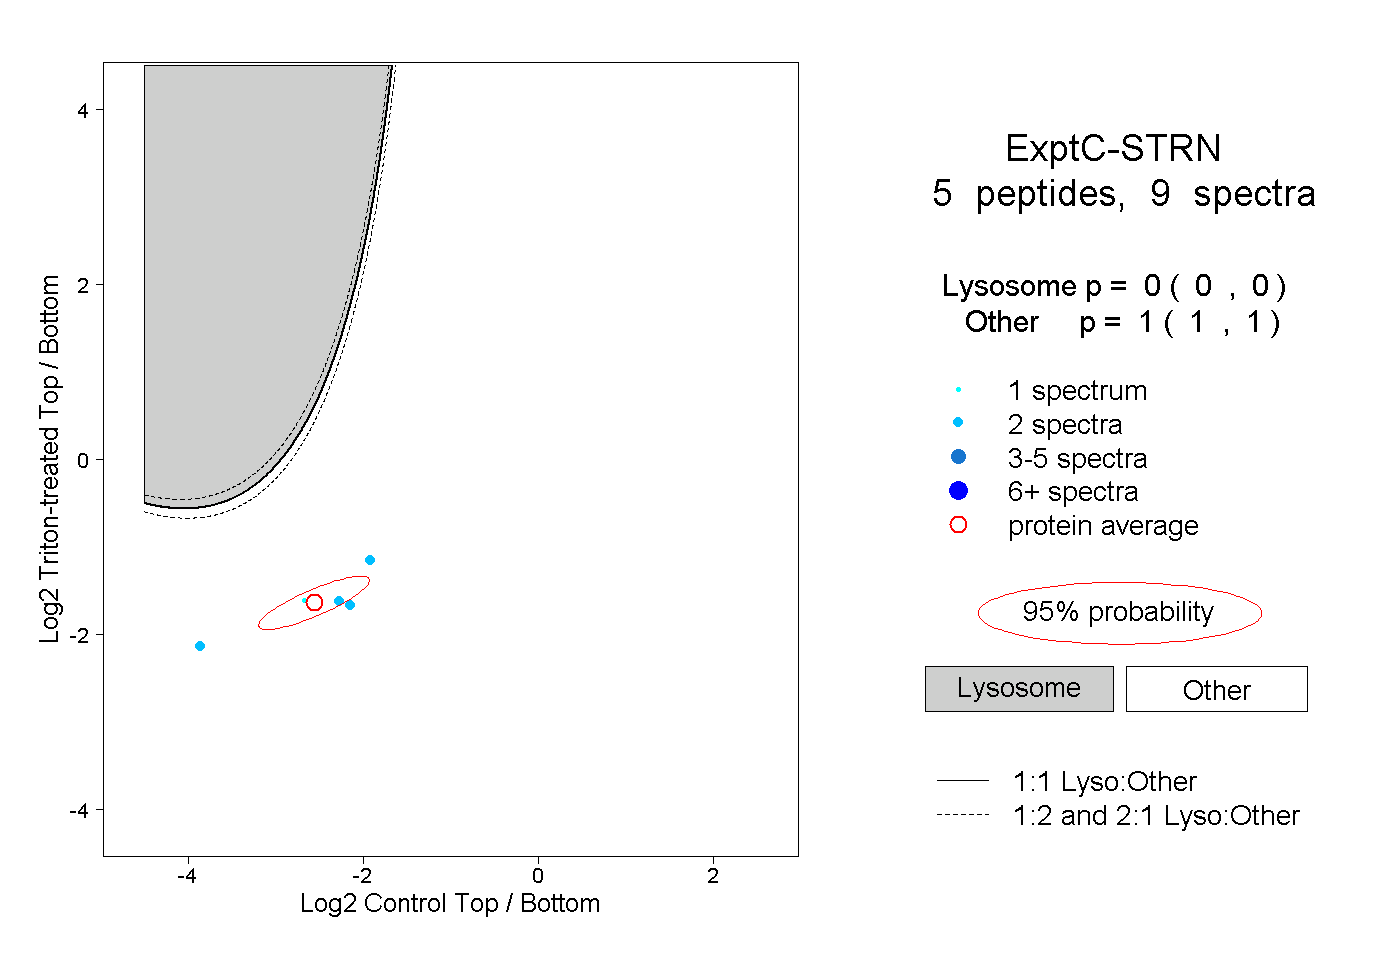 |
|
0.000
0.000 | 0.000 |
|
|
|
|
|
|
|
1.000
1.000 | 1.000 |