 2
2peptides
spectra
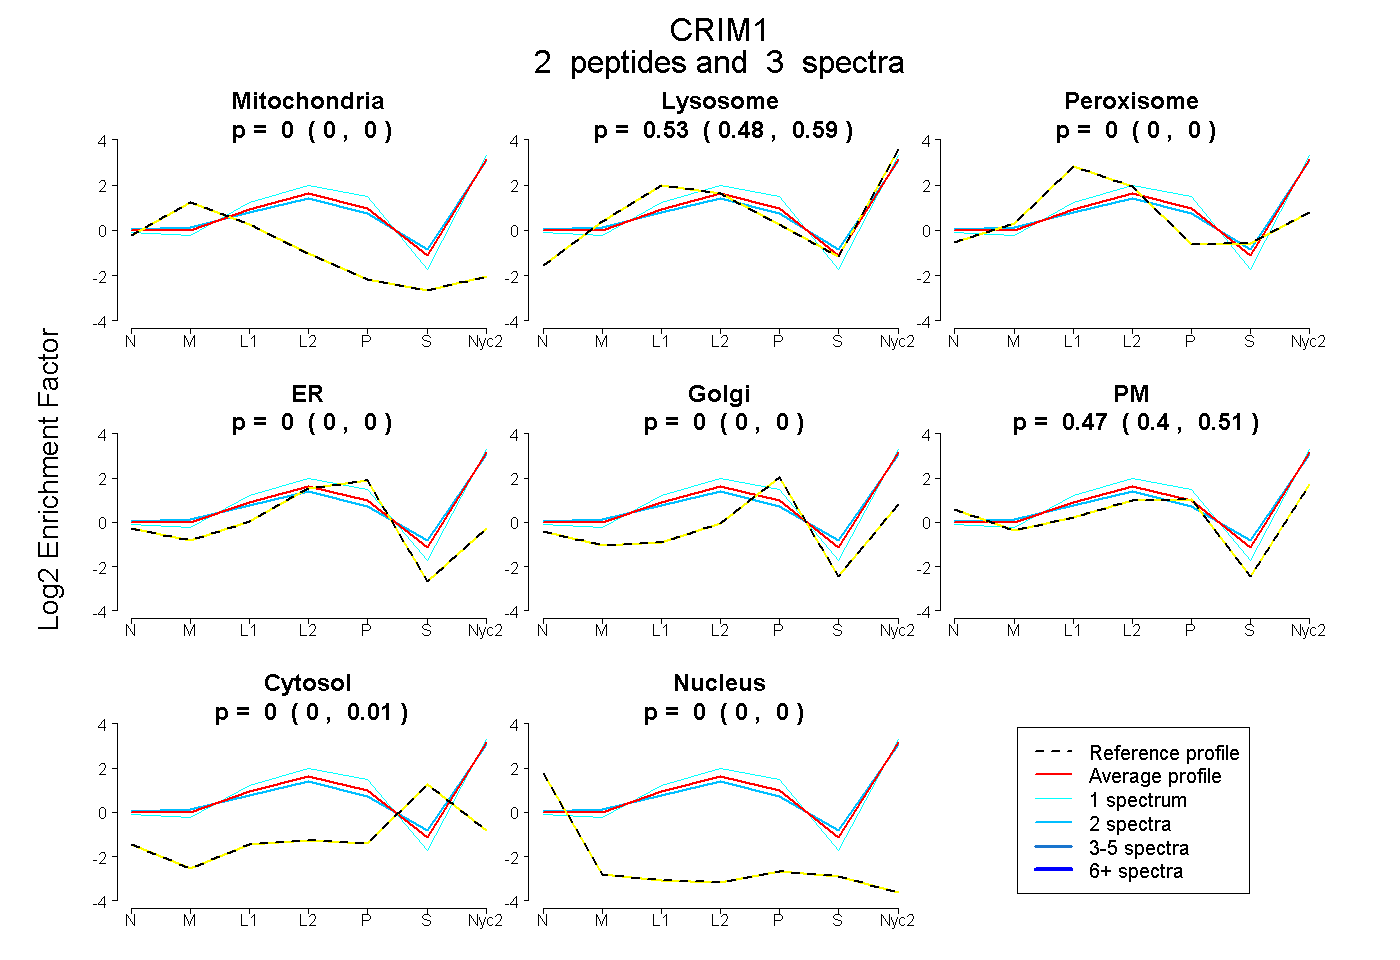
0.000 | 0.000
0.476 | 0.588
0.000 | 0.000
0.000 | 0.000
0.000 | 0.000
0.397 | 0.515
0.000 | 0.014
0.000 | 0.000
1peptide
spectra

NA | NA
NA | NA
2peptides
spectra
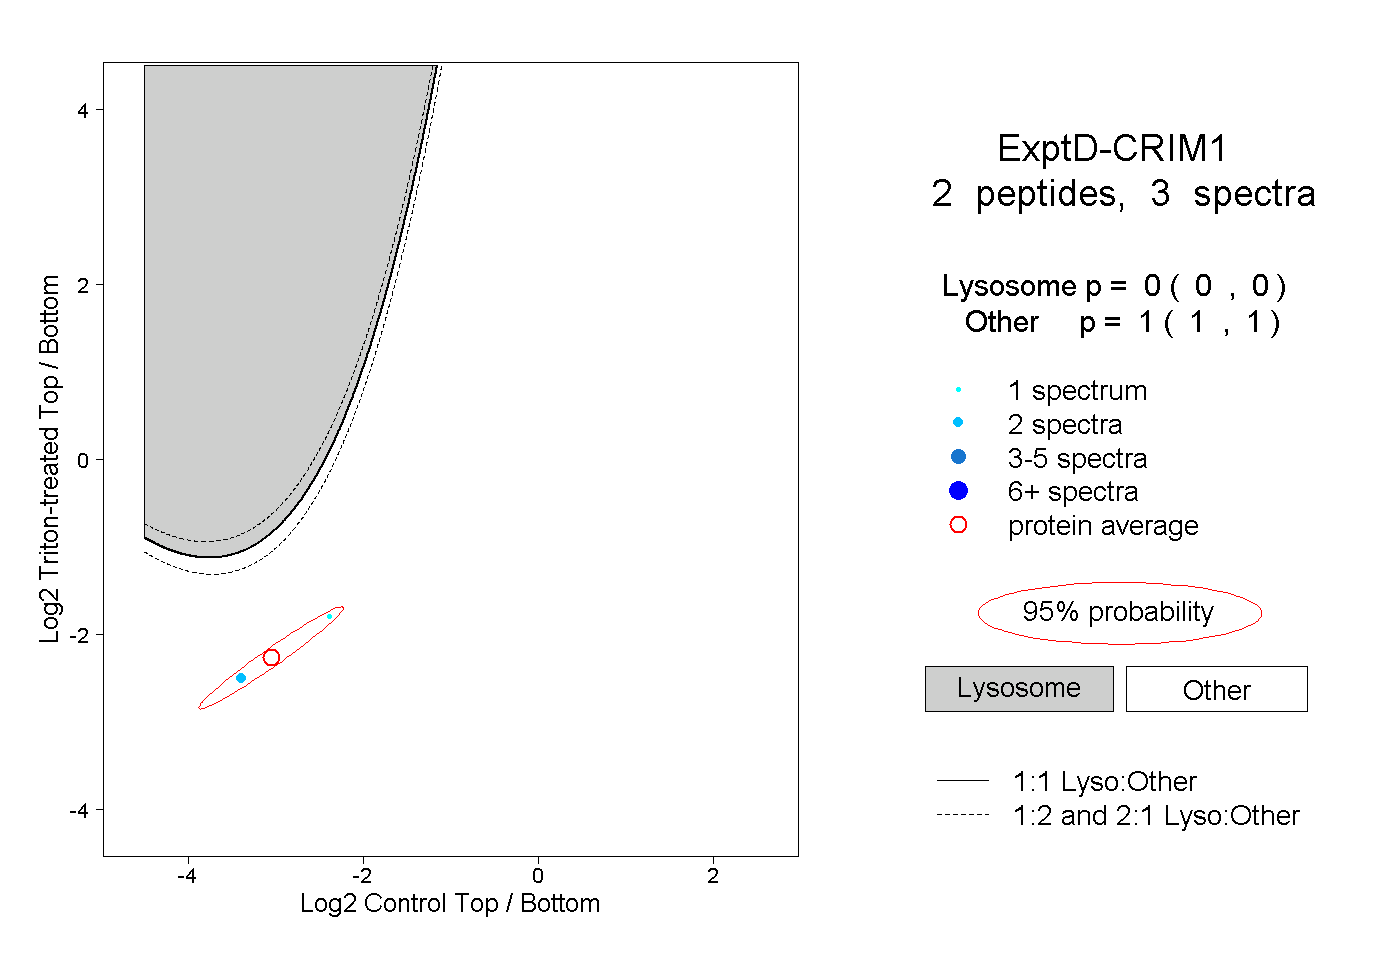
0.000 | 0.000
1.000 | 1.000