 2
2peptides
spectra
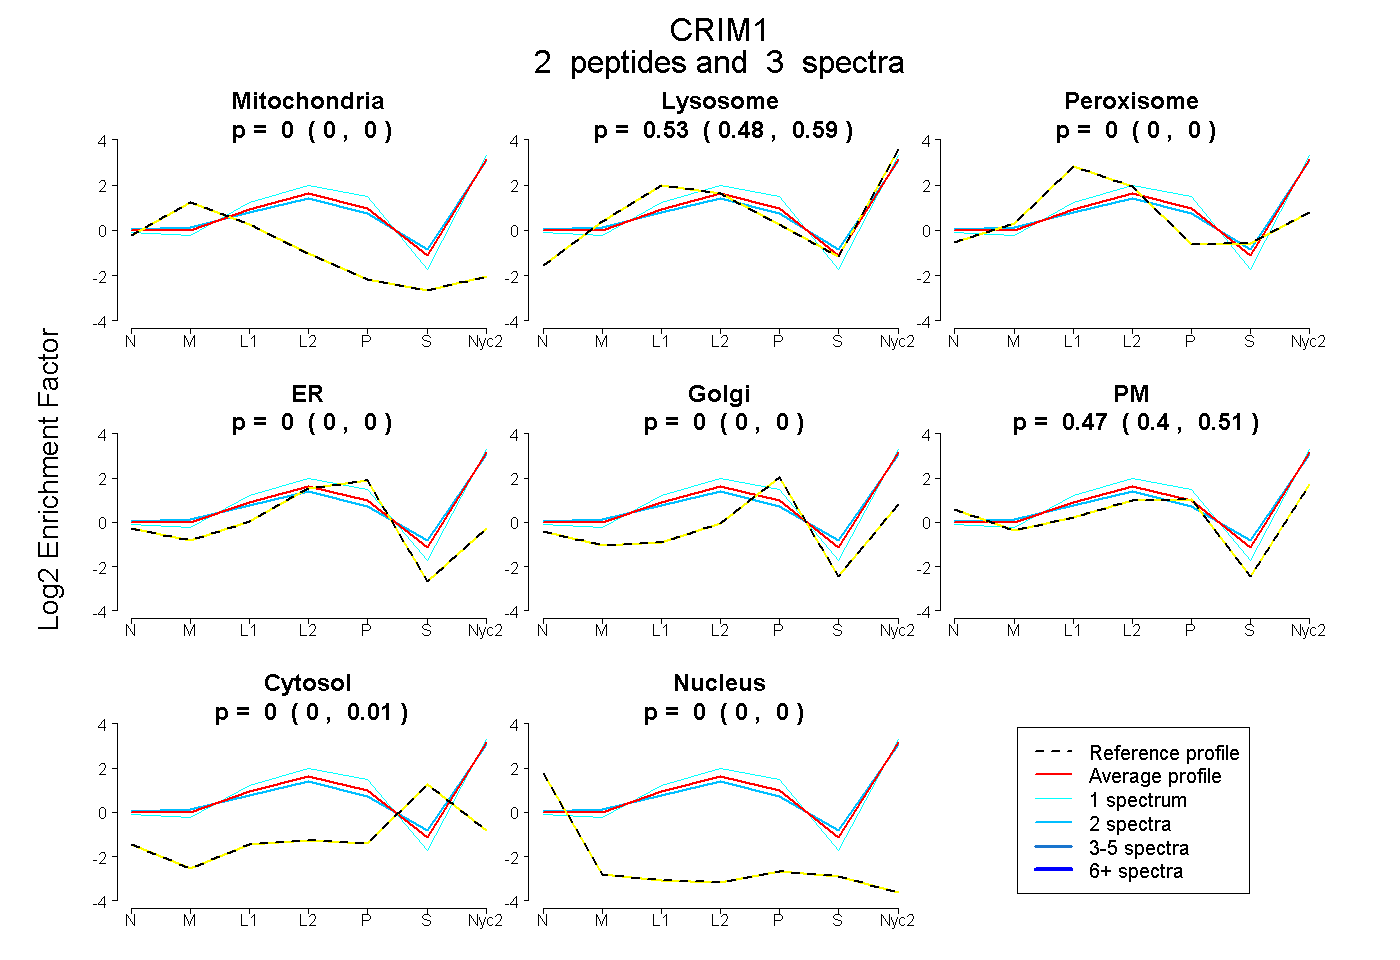
0.000 | 0.000
0.476 | 0.588
0.000 | 0.000
0.000 | 0.000
0.000 | 0.000
0.397 | 0.515
0.000 | 0.014
0.000 | 0.000
| Plot | Mito | Lyso | Perox | ER | Golgi | PM | Cytosol | Nucleus | |||||
| Expt A |
2 peptides |
3 spectra |
|
0.000 0.000 | 0.000 |
0.535 0.476 | 0.588 |
0.000 0.000 | 0.000 |
0.000 0.000 | 0.000 |
0.000 0.000 | 0.000 |
0.465 0.397 | 0.515 |
0.000 0.000 | 0.014 |
0.000 0.000 | 0.000 |
| 1 spectrum, FCPLGFLR | 0.000 | 0.527 | 0.000 | 0.000 | 0.000 | 0.473 | 0.000 | 0.000 | ||
| 2 spectra, TYADEER | 0.000 | 0.538 | 0.000 | 0.000 | 0.000 | 0.430 | 0.032 | 0.000 |
| Plot | Lyso | Other | |||||||||||
| Expt C |
1 peptide |
2 spectra |
 |
0.000 NA | NA |
1.000 NA | NA |
||||||||
| Plot | Lyso | Other | |||||||||||
| Expt D |
2 peptides |
3 spectra |
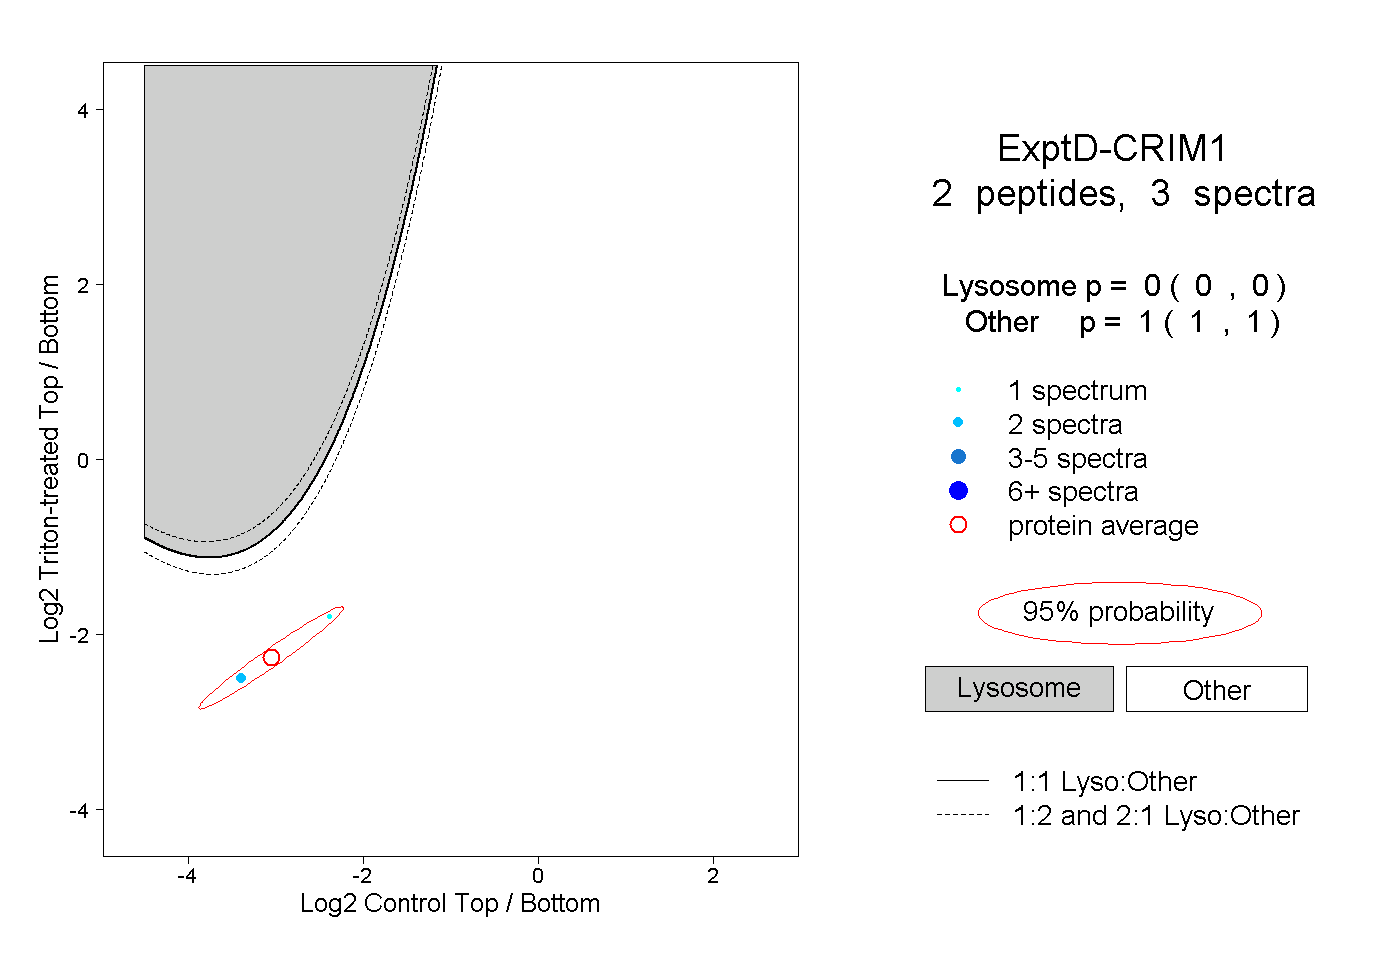 |
0.000 0.000 | 0.000 |
1.000 1.000 | 1.000 |