 22
22peptides
spectra
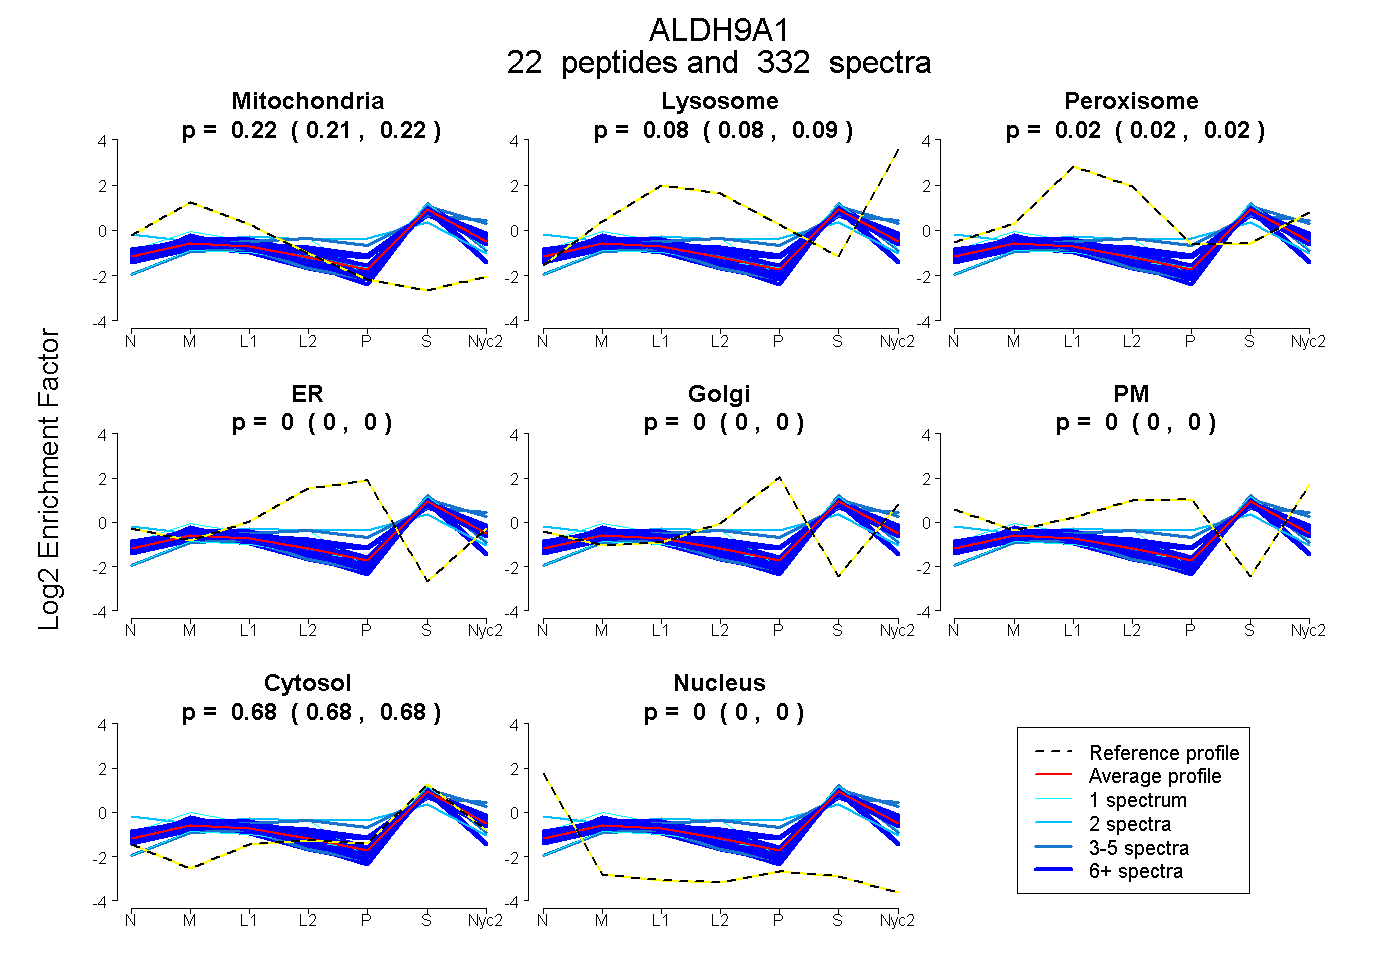
0.215 | 0.217
0.082 | 0.087
0.019 | 0.025
0.000 | 0.000
0.000 | 0.000
0.000 | 0.000
0.676 | 0.678
0.000 | 0.000
19peptides
spectra
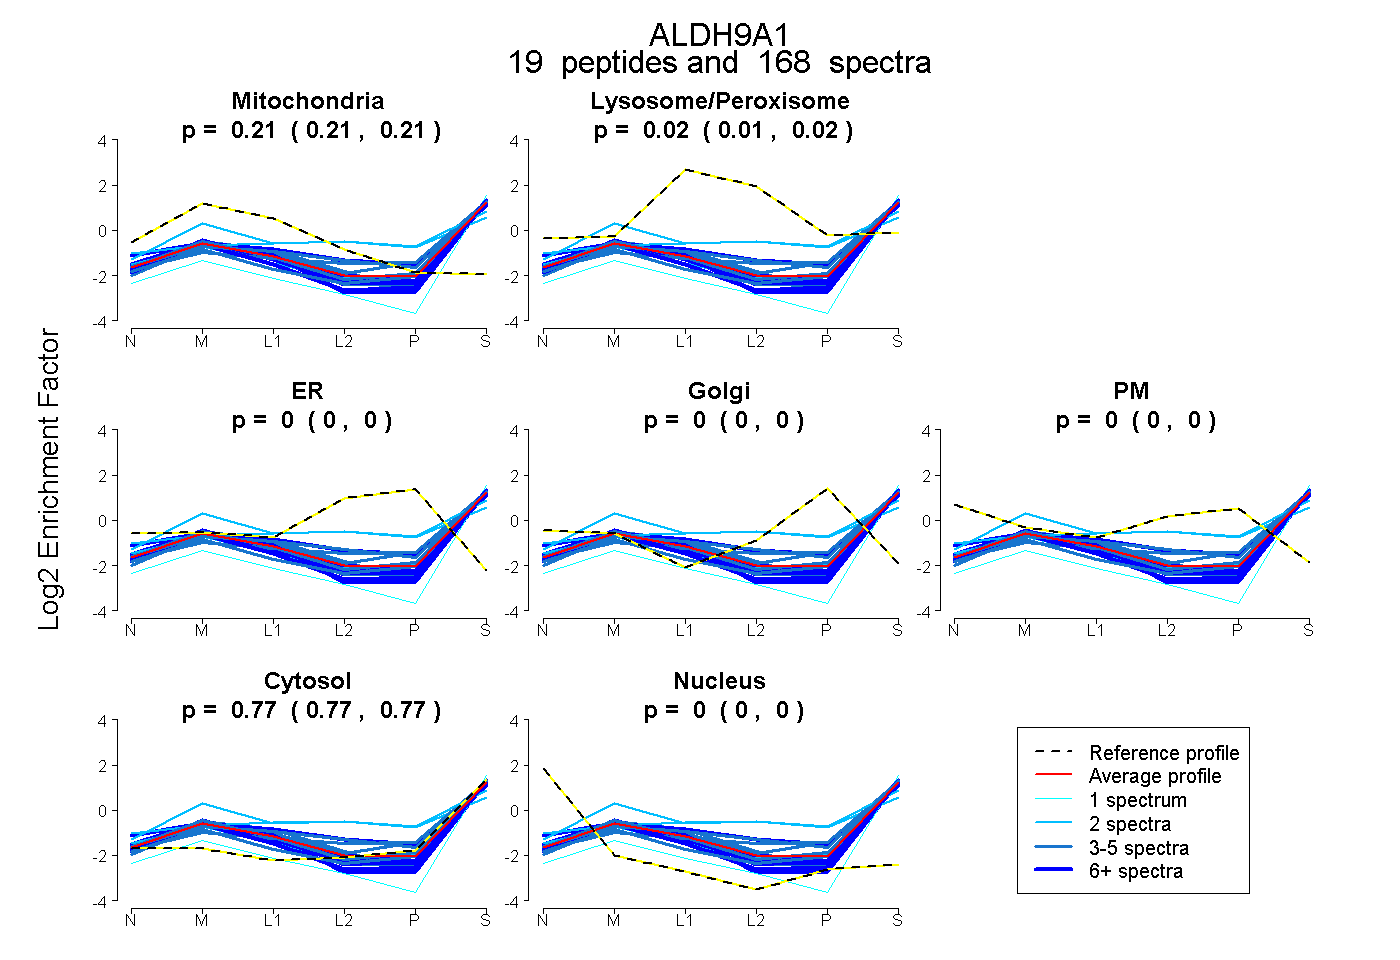
0.207 | 0.212
0.013 | 0.019
0.000 | 0.000
0.000 | 0.000
0.000 | 0.000
0.772 | 0.775
0.000 | 0.000
21peptides
spectra
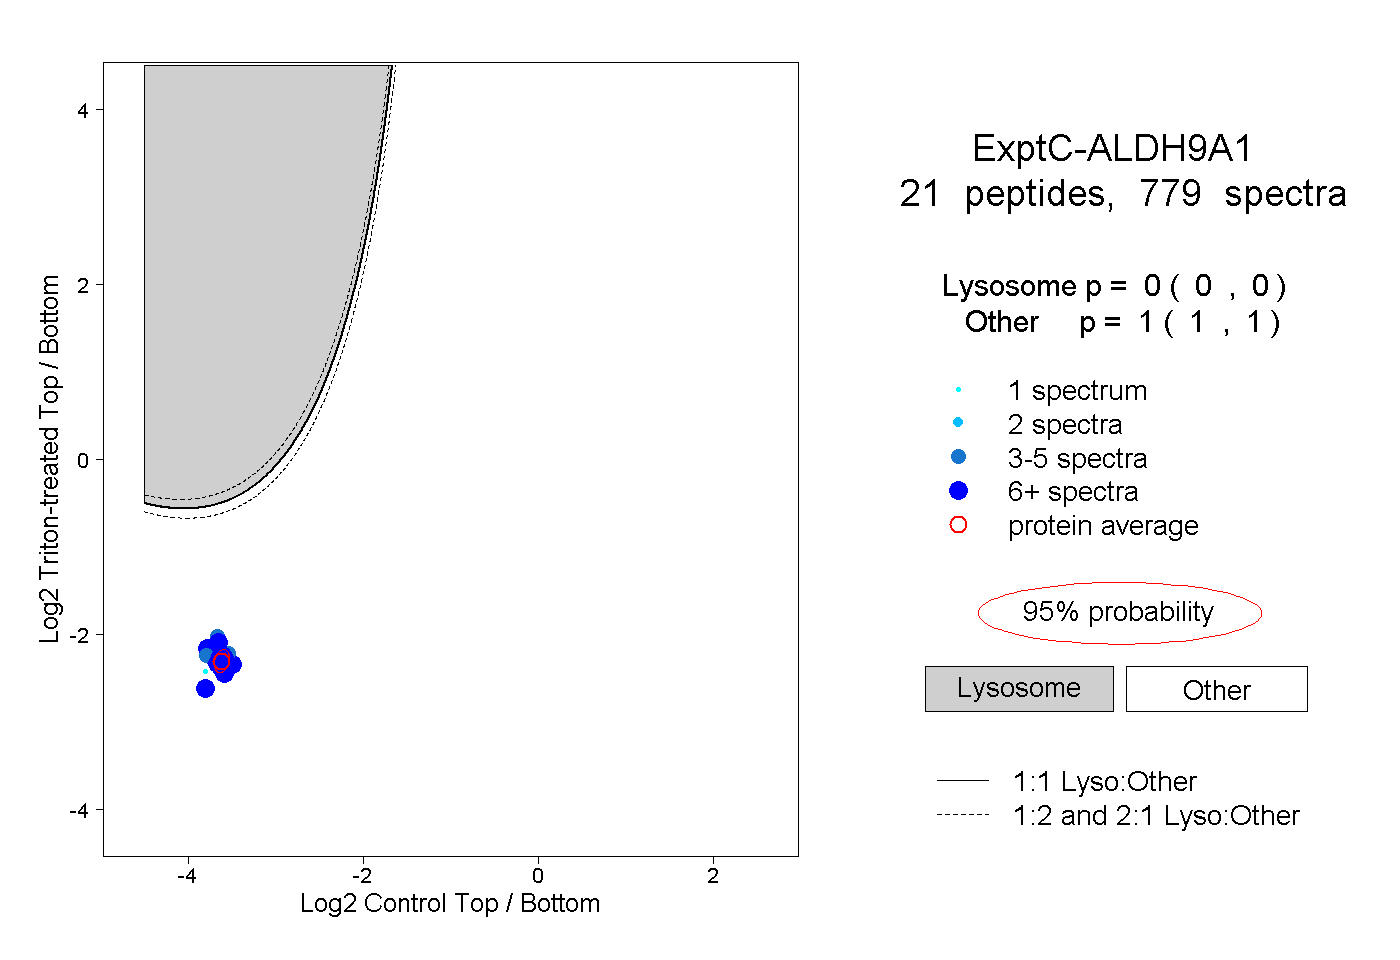
0.000 | 0.000
1.000 | 1.000
10peptides
spectra
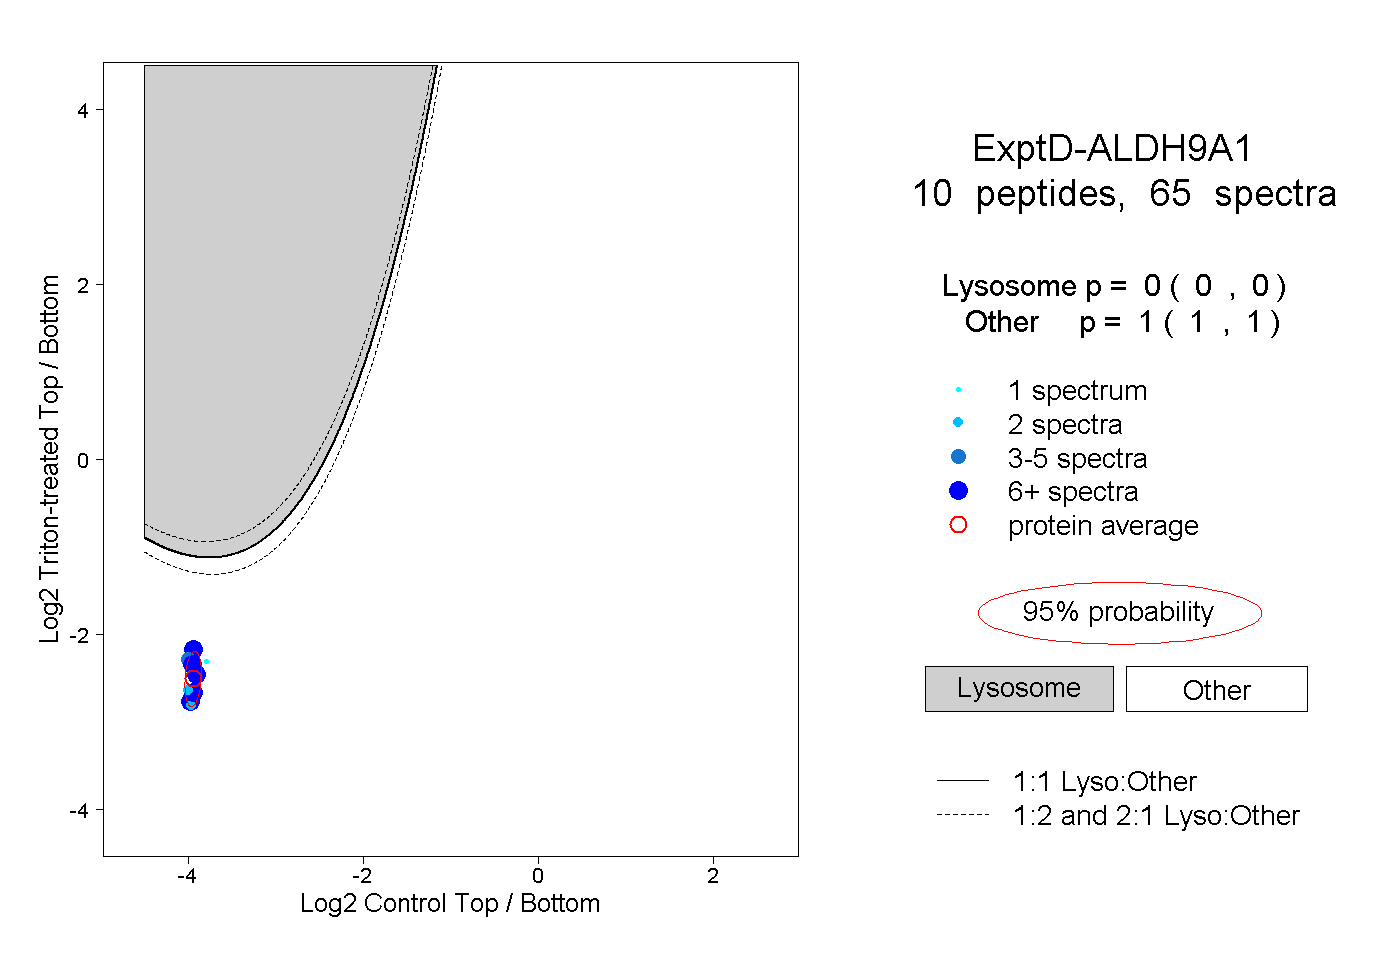
0.000 | 0.000
1.000 | 1.000