 22
22peptides
spectra
0.215 | 0.217
0.082 | 0.087
0.019 | 0.025
0.000 | 0.000
0.000 | 0.000
0.000 | 0.000
0.676 | 0.678
0.000 | 0.000
| Plot | Mito | Lyso | Perox | ER | Golgi | PM | Cytosol | Nucleus | |||||
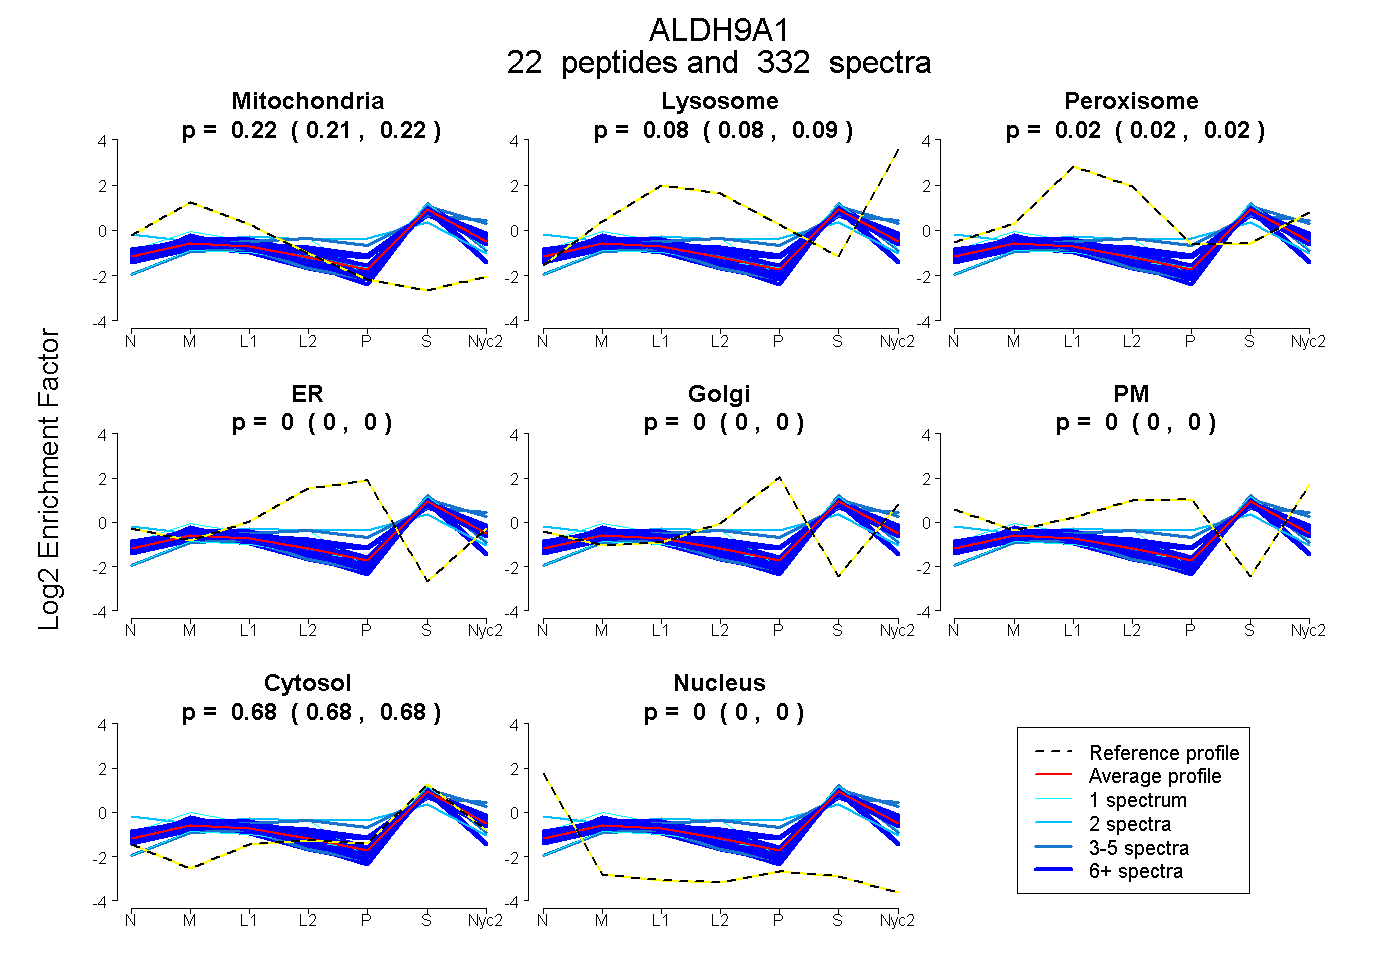
| Expt A |
22 peptides |
332 spectra |
|
0.216 0.215 | 0.217 |
0.084 0.082 | 0.087 |
0.022 0.019 | 0.025 |
0.000 0.000 | 0.000 |
0.000 0.000 | 0.000 |
0.000 0.000 | 0.000 |
0.677 0.676 | 0.678 |
0.000 0.000 | 0.000 |
| 1 spectrum, HGYYMTPCILTNCTDDMTCVK | 0.222 | 0.100 | 0.141 | 0.000 | 0.000 | 0.000 | 0.537 | 0.000 | ||
| 4 spectra, DEIAIMETINNGK | 0.112 | 0.180 | 0.000 | 0.000 | 0.000 | 0.000 | 0.708 | 0.000 | ||
| 15 spectra, EVNLAVENAK | 0.165 | 0.070 | 0.106 | 0.000 | 0.000 | 0.000 | 0.659 | 0.000 | ||
| 15 spectra, IMEMAAK | 0.219 | 0.152 | 0.041 | 0.000 | 0.000 | 0.000 | 0.588 | 0.000 | ||
| 13 spectra, VTIEYYSQLK | 0.278 | 0.053 | 0.007 | 0.000 | 0.000 | 0.000 | 0.662 | 0.000 | ||
| 5 spectra, SPLIIFSDCNMK | 0.204 | 0.001 | 0.000 | 0.000 | 0.000 | 0.000 | 0.795 | 0.000 | ||
| 4 spectra, STGTFVVSQPLNYR | 0.070 | 0.243 | 0.043 | 0.000 | 0.000 | 0.062 | 0.583 | 0.000 | ||
| 6 spectra, AGAPNGLFNVVQGGAATGQFLCQHR | 0.285 | 0.000 | 0.026 | 0.000 | 0.000 | 0.000 | 0.689 | 0.000 | ||
| 12 spectra, ANDTTFGLAAGVFTR | 0.236 | 0.039 | 0.000 | 0.000 | 0.000 | 0.000 | 0.725 | 0.000 | ||
| 17 spectra, VLGFVR | 0.273 | 0.068 | 0.000 | 0.000 | 0.000 | 0.000 | 0.658 | 0.000 | ||
| 5 spectra, GIKPITLELGGK | 0.192 | 0.103 | 0.031 | 0.000 | 0.000 | 0.000 | 0.674 | 0.000 | ||
| 17 spectra, EIADAFTK | 0.200 | 0.046 | 0.000 | 0.000 | 0.000 | 0.000 | 0.755 | 0.000 | ||
| 2 spectra, EQGATVLCGGEPYAPEDPK | 0.187 | 0.000 | 0.171 | 0.150 | 0.000 | 0.000 | 0.492 | 0.000 | ||
| 8 spectra, CQVLLEAAR | 0.300 | 0.000 | 0.046 | 0.000 | 0.000 | 0.000 | 0.654 | 0.000 | ||
| 59 spectra, MGPLINAPHLER | 0.187 | 0.187 | 0.018 | 0.000 | 0.000 | 0.000 | 0.608 | 0.000 | ||
| 46 spectra, AFEPATGR | 0.200 | 0.087 | 0.000 | 0.000 | 0.000 | 0.000 | 0.713 | 0.000 | ||
| 22 spectra, VEPVDASGTEK | 0.200 | 0.050 | 0.133 | 0.000 | 0.000 | 0.000 | 0.617 | 0.000 | ||
| 14 spectra, VSFTGSVPTGMK | 0.171 | 0.149 | 0.014 | 0.000 | 0.000 | 0.000 | 0.667 | 0.000 | ||
| 43 spectra, IGDPLLEDTR | 0.226 | 0.056 | 0.000 | 0.000 | 0.000 | 0.000 | 0.718 | 0.000 | ||
| 1 spectrum, TVCVEMGDVESPFENQ | 0.168 | 0.045 | 0.000 | 0.000 | 0.000 | 0.000 | 0.787 | 0.000 | ||
| 9 spectra, EIATFK | 0.212 | 0.068 | 0.000 | 0.000 | 0.000 | 0.000 | 0.720 | 0.000 | ||
| 14 spectra, SLFEAR | 0.226 | 0.024 | 0.000 | 0.000 | 0.000 | 0.000 | 0.749 | 0.000 |
| Plot | Mito | Lyso or Perox | ER | Golgi | PM | Cytosol | Nucleus | ||||||
| Expt B |
19 peptides |
168 spectra |
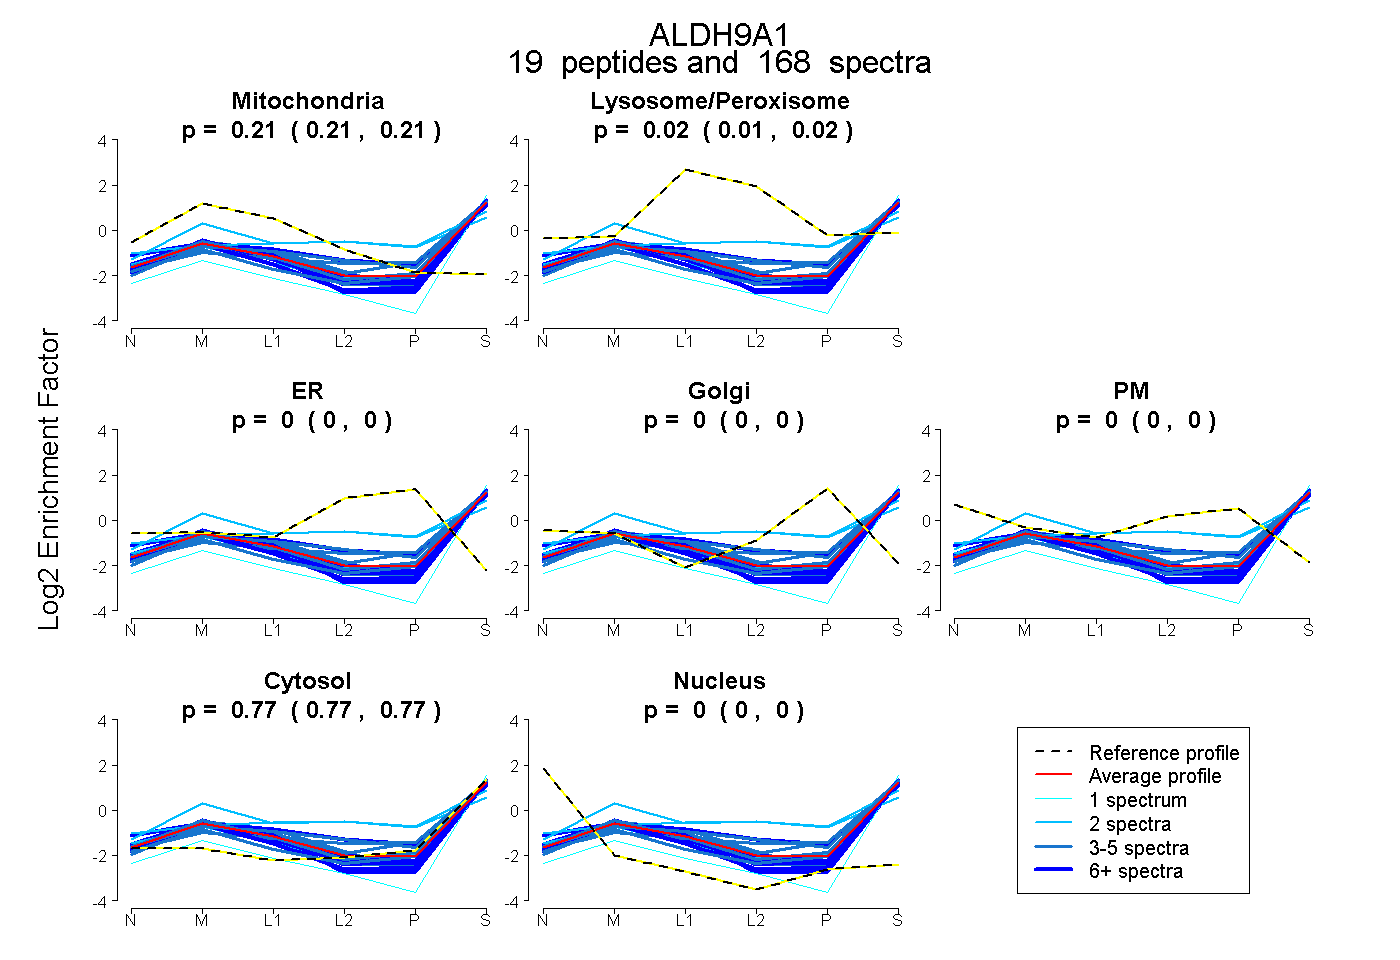 |
0.210 0.207 | 0.212 |
0.017 0.013 | 0.019 |
0.000 0.000 | 0.000 |
0.000 0.000 | 0.000 |
0.000 0.000 | 0.000 |
0.773 0.772 | 0.775 |
0.000 0.000 | 0.000 |
|||
| Plot | Lyso | Other | |||||||||||
| Expt C |
21 peptides |
779 spectra |
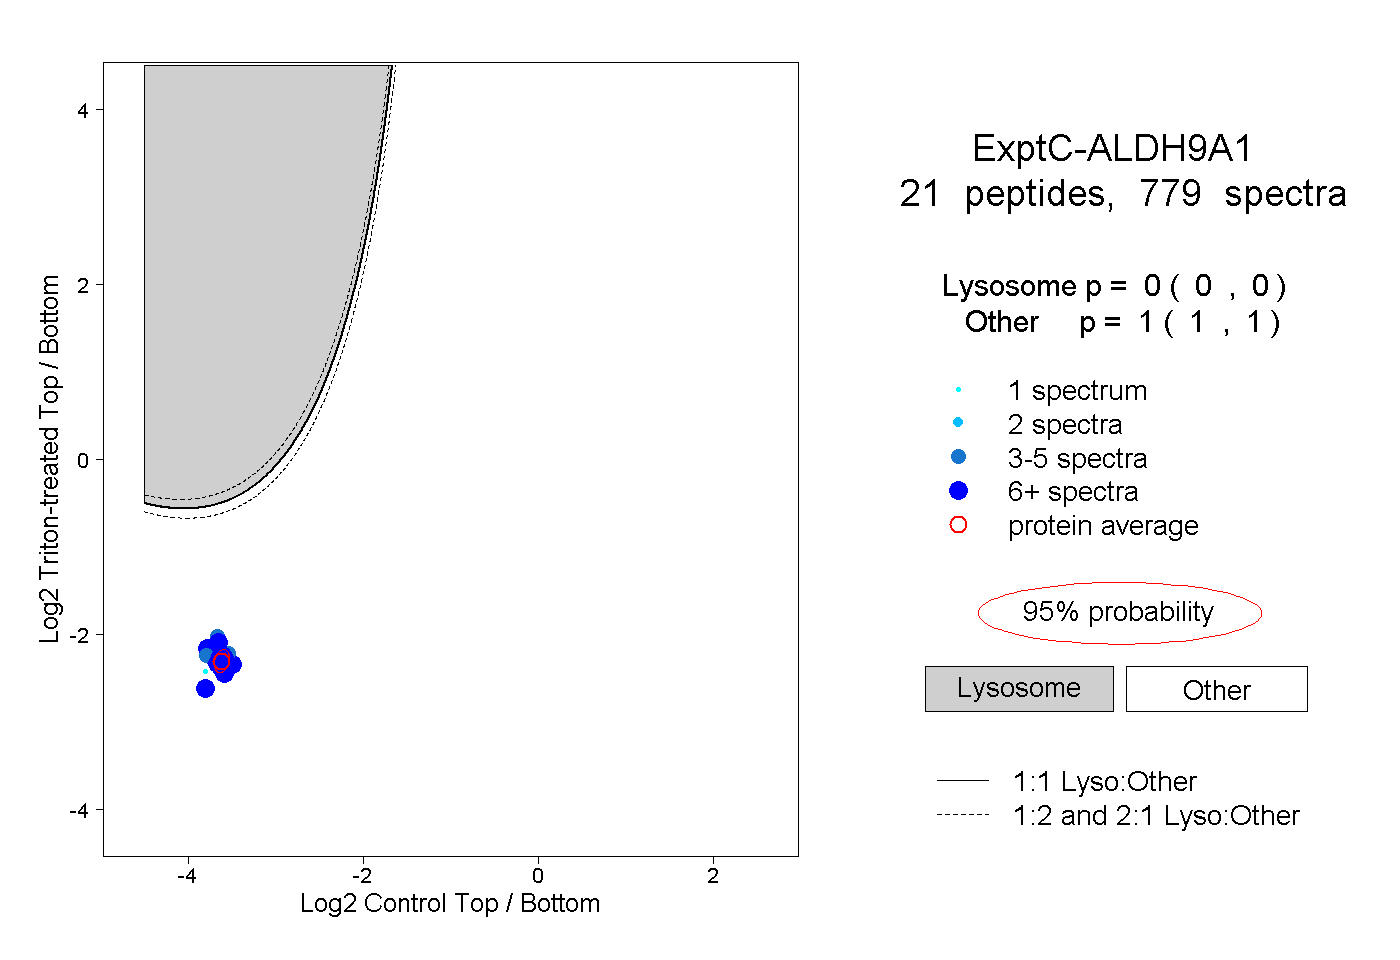 |
0.000 0.000 | 0.000 |
1.000 1.000 | 1.000 |
||||||||
| Plot | Lyso | Other | |||||||||||
| Expt D |
10 peptides |
65 spectra |
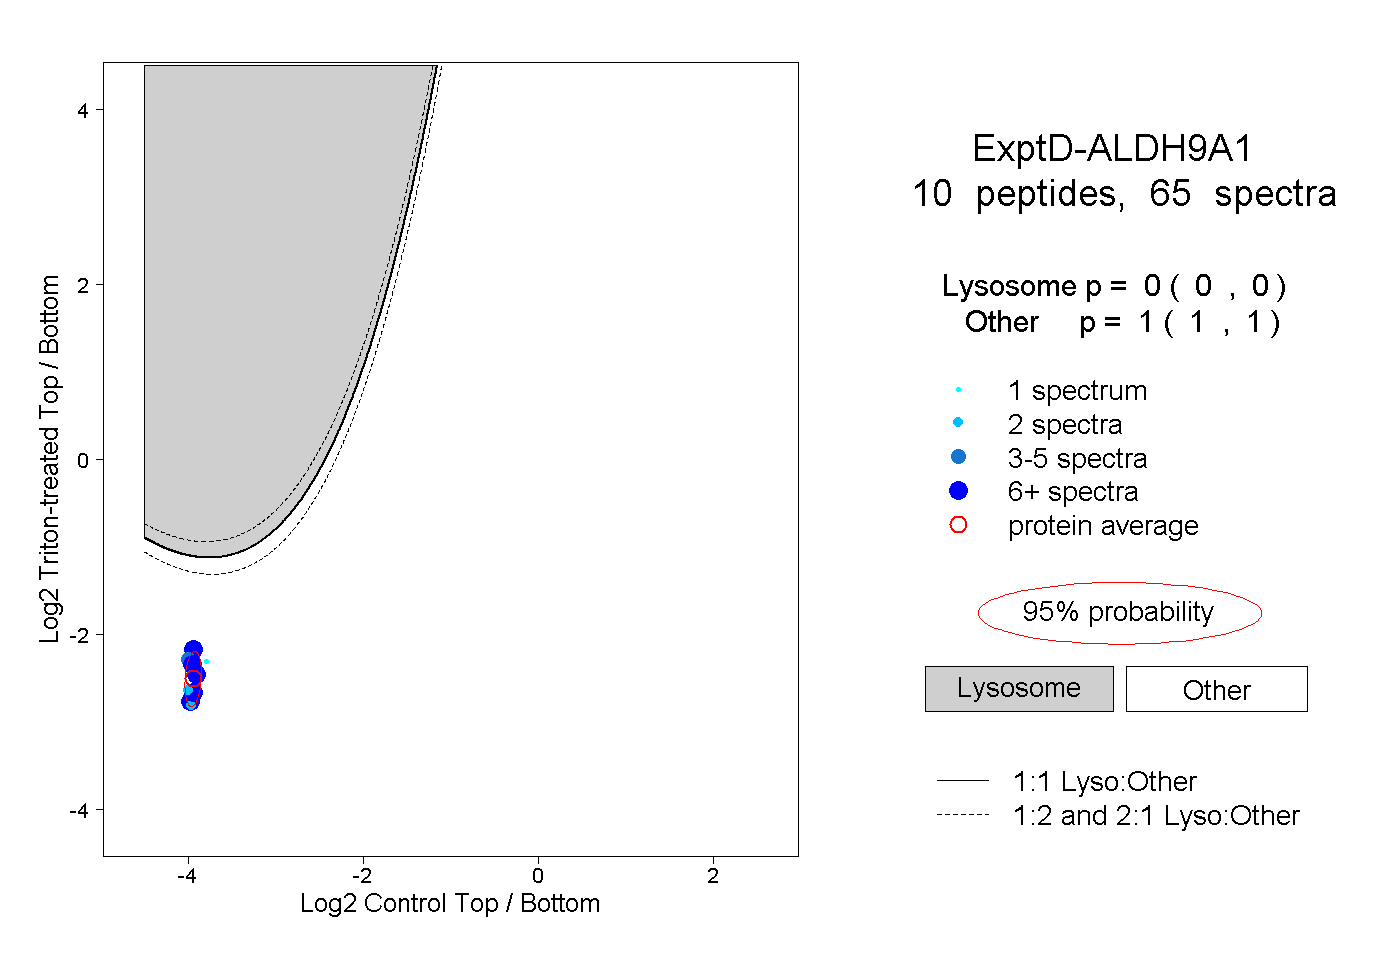 |
0.000 0.000 | 0.000 |
1.000 1.000 | 1.000 |