 3
3peptides
spectra

0.000 | 0.000
0.053 | 0.244
0.000 | 0.291
0.000 | 0.257
0.055 | 0.503
0.000 | 0.274
0.044 | 0.223
0.000 | 0.000
3peptides
spectra
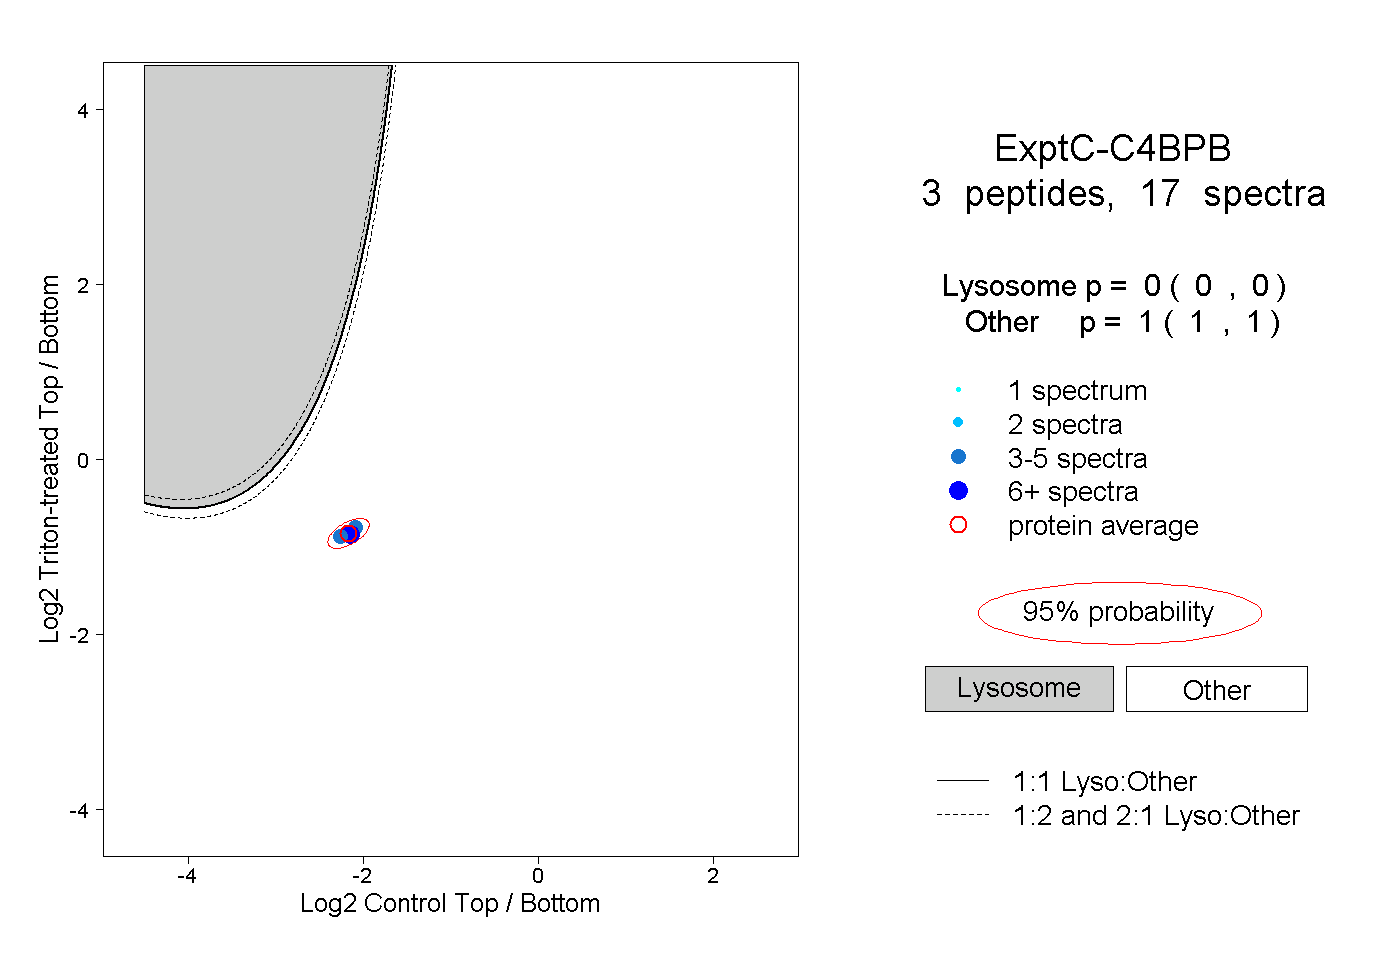
0.000 | 0.000
1.000 | 1.000
1peptide
spectrum
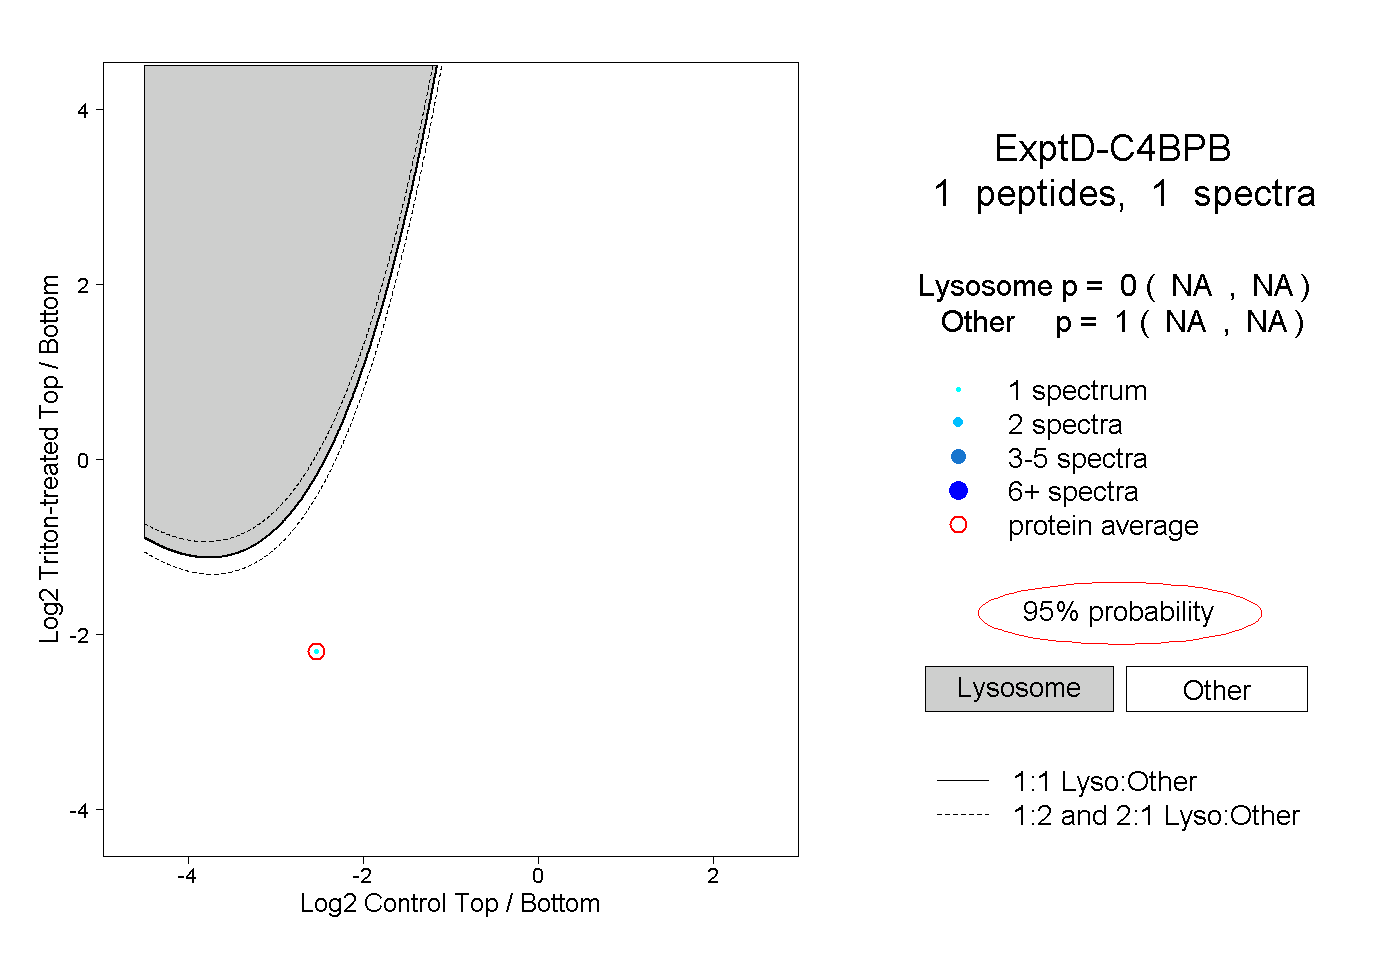
NA | NA
NA | NA