 3
3peptides
spectra

0.000 | 0.000
0.053 | 0.244
0.000 | 0.291
0.000 | 0.257
0.055 | 0.503
0.000 | 0.274
0.044 | 0.223
0.000 | 0.000
| Plot | Mito | Lyso | Perox | ER | Golgi | PM | Cytosol | Nucleus | |||||
| Expt A |
3 peptides |
3 spectra |
|
0.000 0.000 | 0.000 |
0.157 0.053 | 0.244 |
0.160 0.000 | 0.291 |
0.118 0.000 | 0.257 |
0.311 0.055 | 0.503 |
0.117 0.000 | 0.274 |
0.138 0.044 | 0.223 |
0.000 0.000 | 0.000 |
| 1 spectrum, AILAFQESK | 0.000 | 0.109 | 0.087 | 0.178 | 0.000 | 0.280 | 0.346 | 0.000 | ||
| 1 spectrum, EGGITMEELK | 0.128 | 0.190 | 0.140 | 0.123 | 0.362 | 0.057 | 0.000 | 0.000 | ||
| 1 spectrum, GYHLVGK | 0.000 | 0.349 | 0.010 | 0.206 | 0.353 | 0.000 | 0.082 | 0.000 |
| Plot | Lyso | Other | |||||||||||
| Expt C |
3 peptides |
17 spectra |
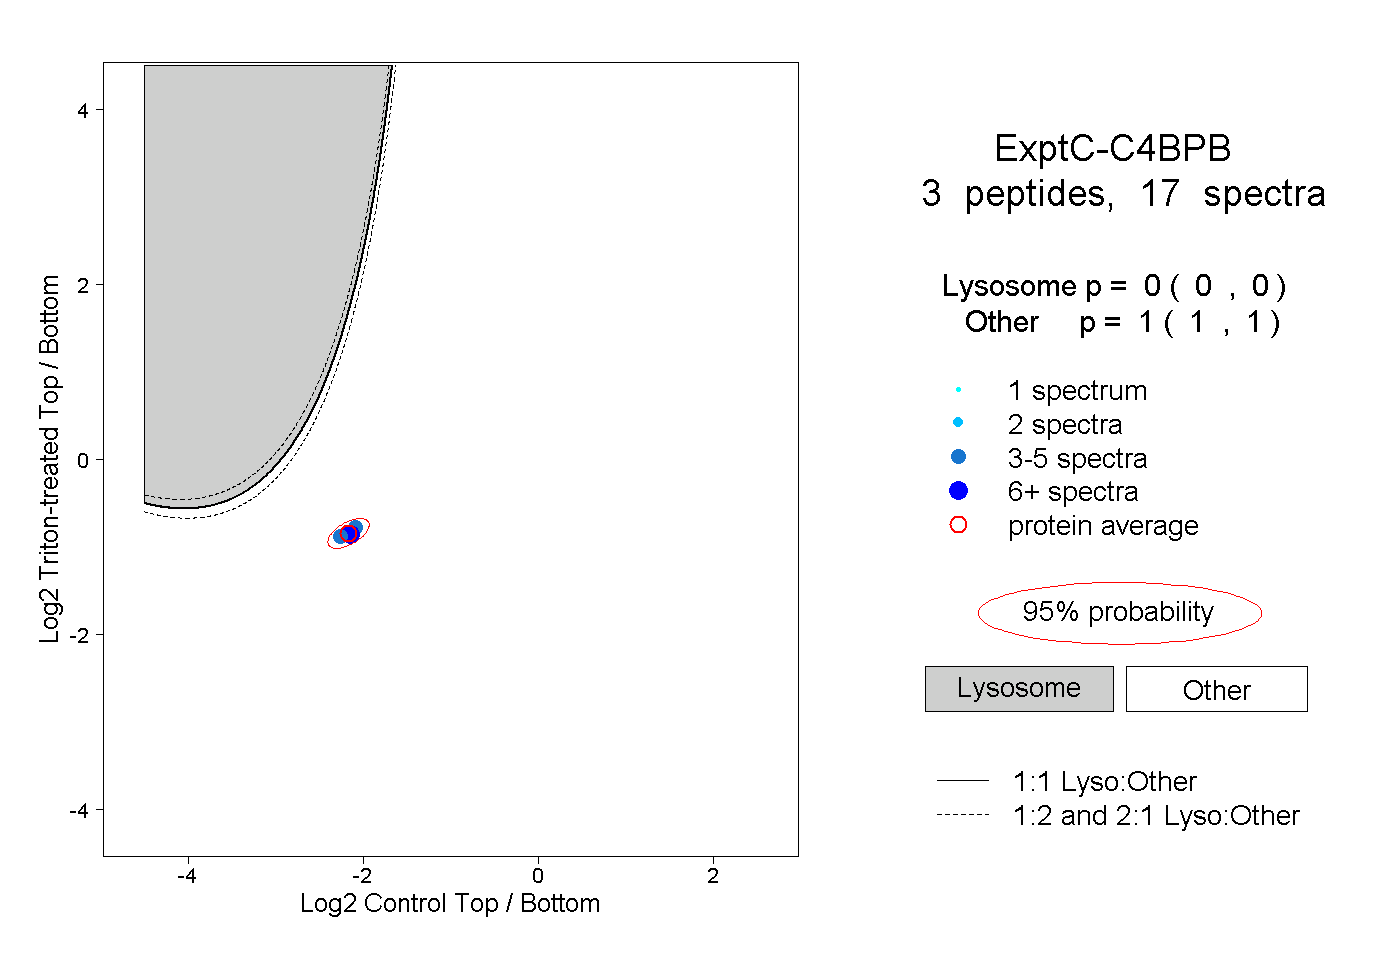 |
0.000 0.000 | 0.000 |
1.000 1.000 | 1.000 |
||||||||
| Plot | Lyso | Other | |||||||||||
| Expt D |
1 peptide |
1 spectrum |
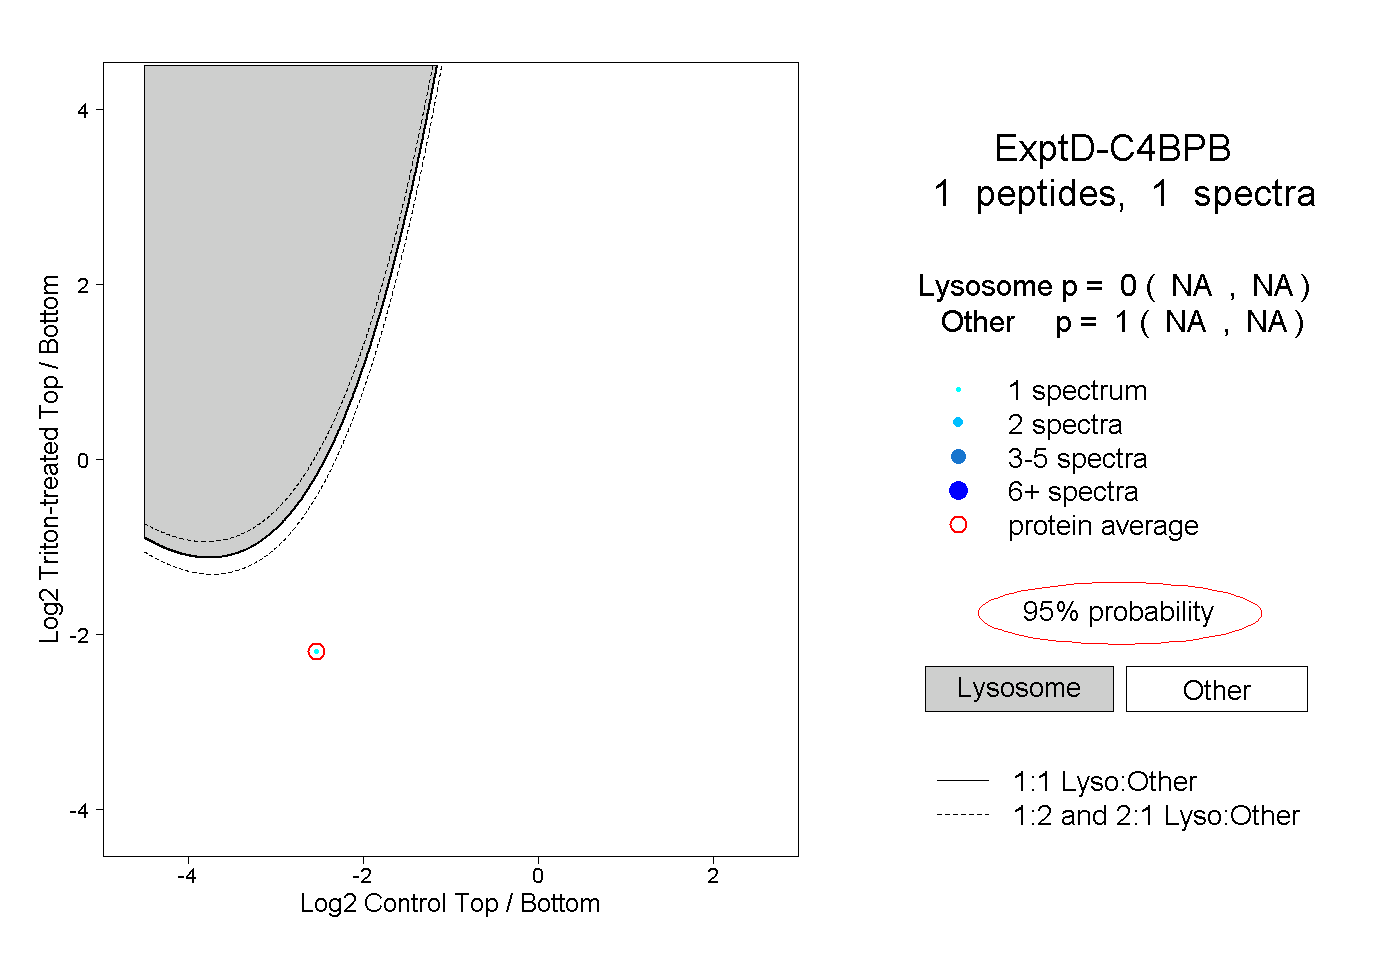 |
0.000 NA | NA |
1.000 NA | NA |