 14
14peptides
spectra
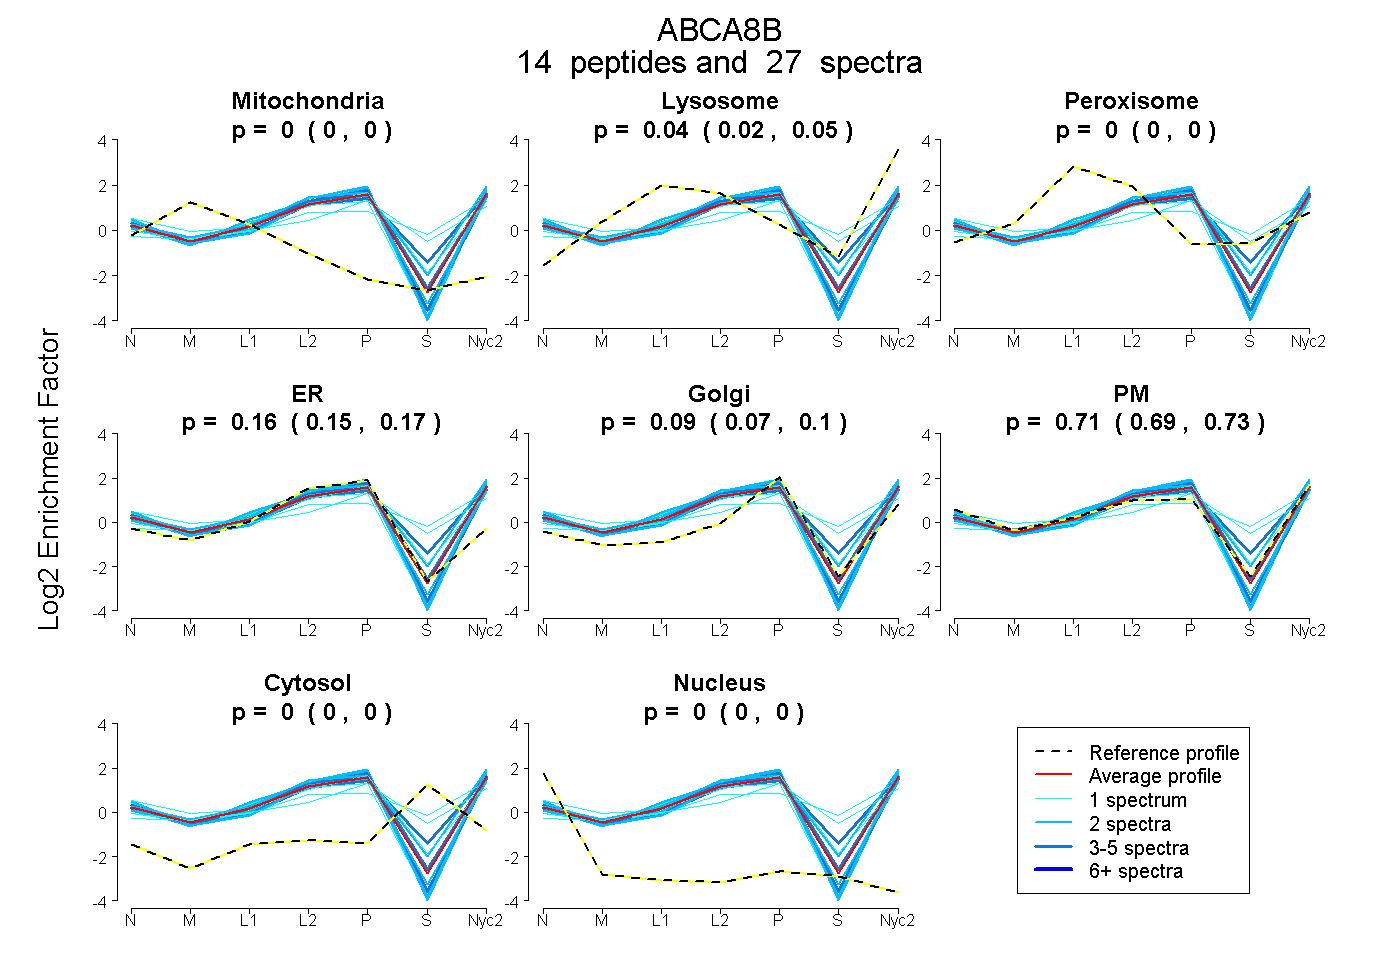
0.000 | 0.000
0.023 | 0.051
0.000 | 0.000
0.148 | 0.173
0.069 | 0.101
0.688 | 0.734
0.000 | 0.000
0.000 | 0.000
1peptide
spectrum
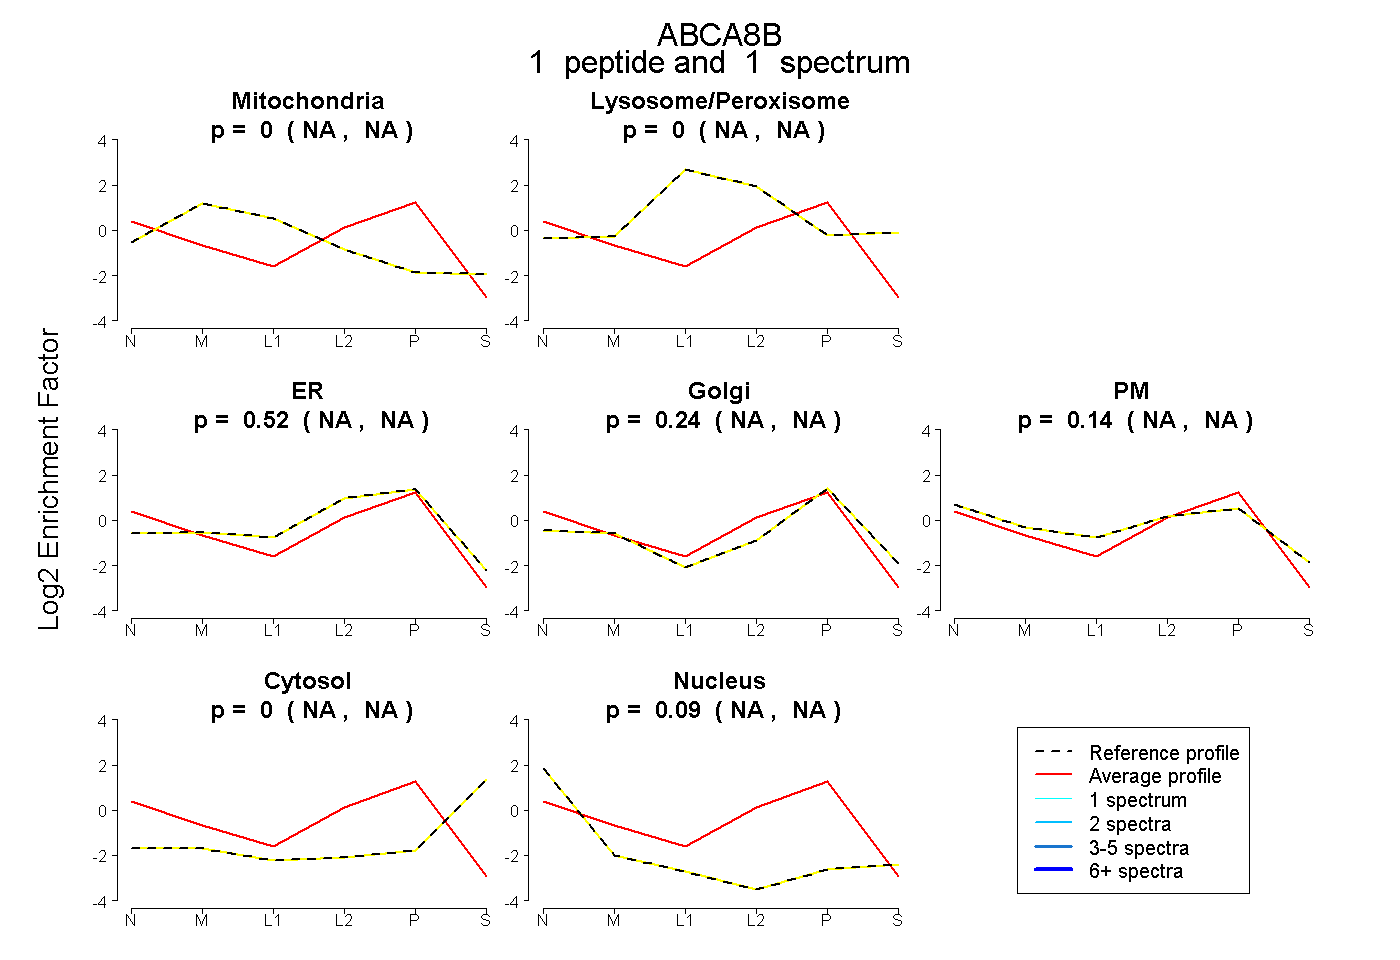
NA | NA
NA | NA
NA | NA
NA | NA
NA | NA
NA | NA
NA | NA
11peptides
spectra
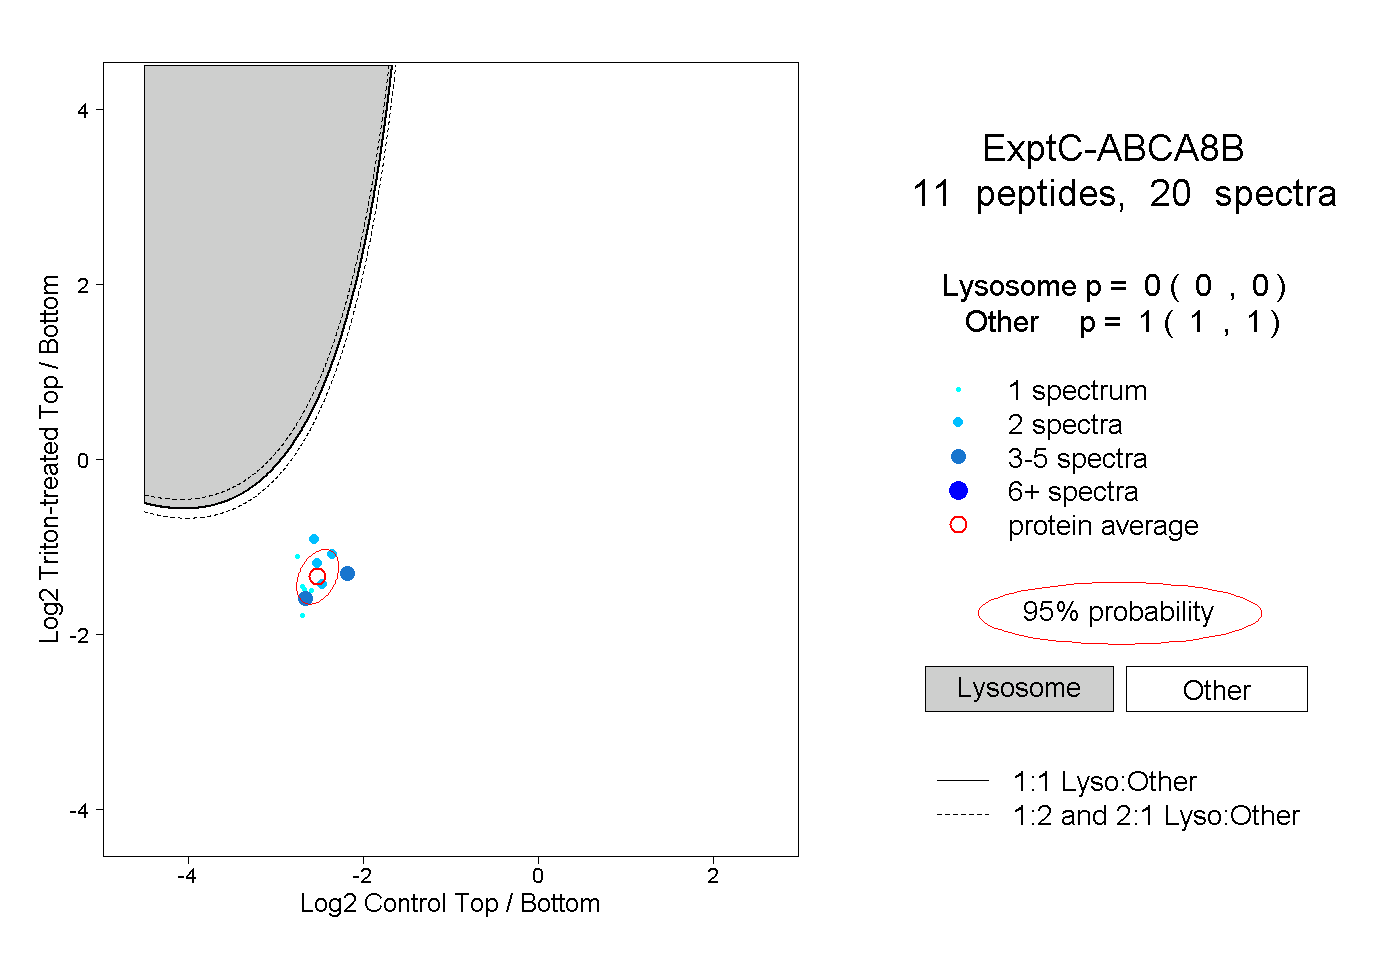
0.000 | 0.000
1.000 | 1.000
1peptide
spectrum
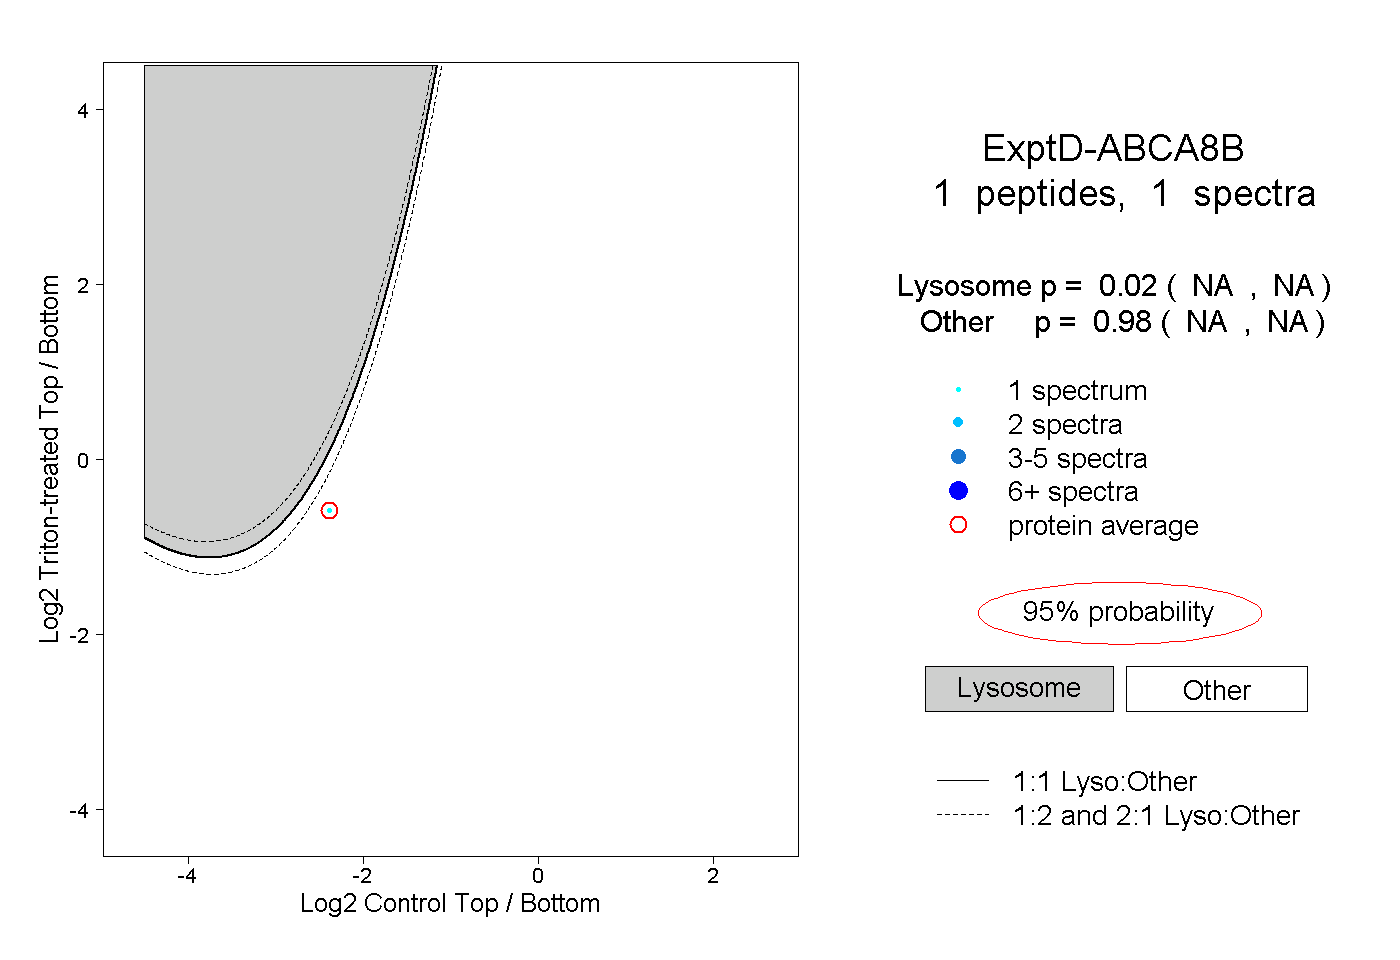
NA | NA
NA | NA