 14
14peptides
spectra
0.000 | 0.000
0.023 | 0.051
0.000 | 0.000
0.148 | 0.173
0.069 | 0.101
0.688 | 0.734
0.000 | 0.000
0.000 | 0.000
| Plot | Mito | Lyso | Perox | ER | Golgi | PM | Cytosol | Nucleus | |||||
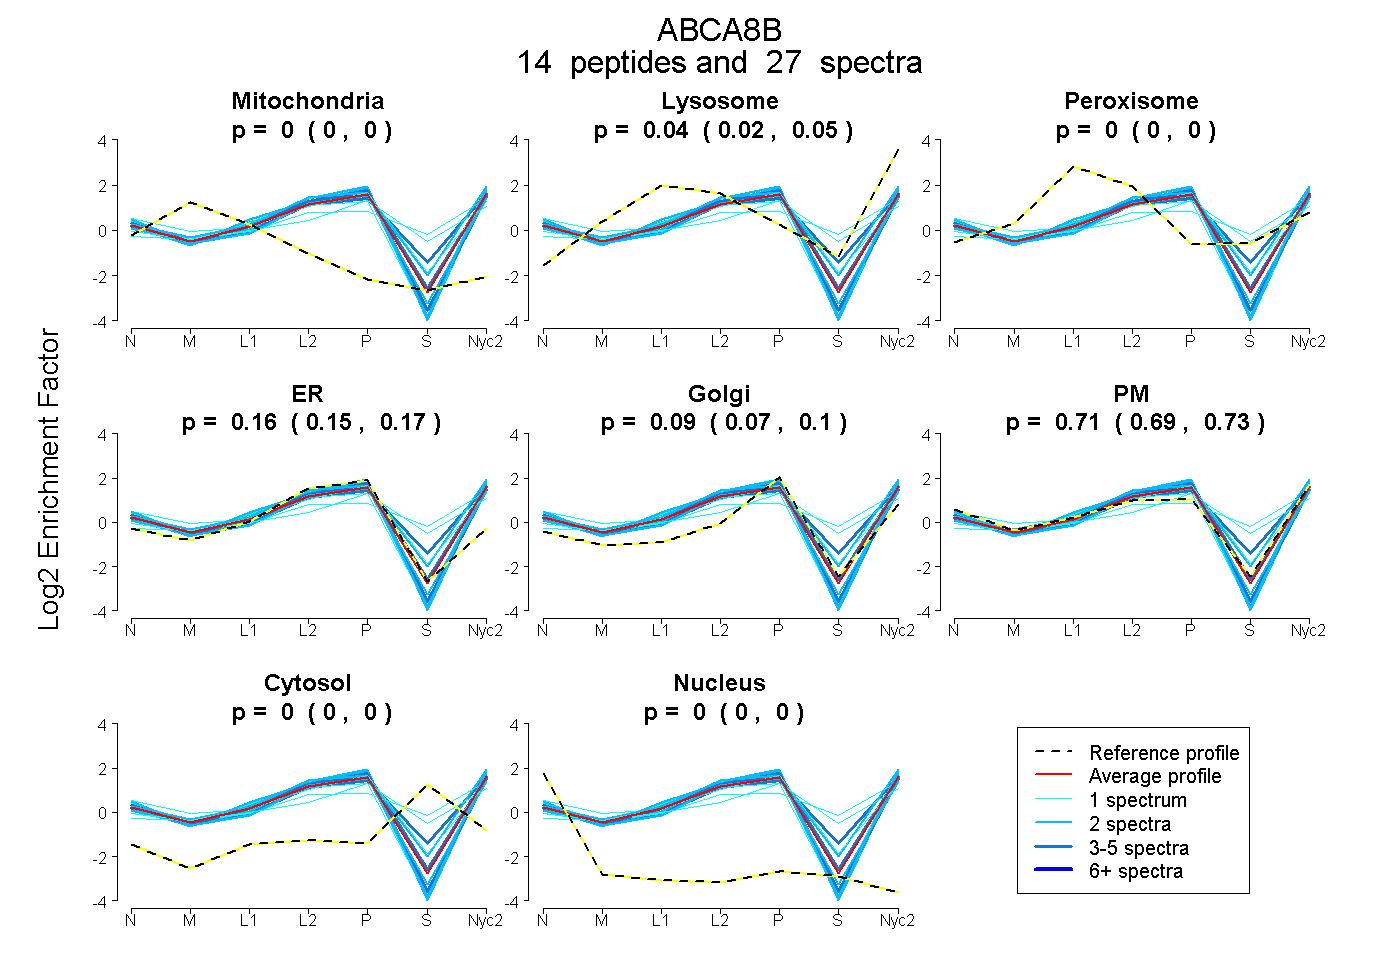
| Expt A |
14 peptides |
27 spectra |
|
0.000 0.000 | 0.000 |
0.038 0.023 | 0.051 |
0.000 0.000 | 0.000 |
0.162 0.148 | 0.173 |
0.088 0.069 | 0.101 |
0.712 0.688 | 0.734 |
0.000 0.000 | 0.000 |
0.000 0.000 | 0.000 |
| 1 spectrum, TGSLALWR | 0.000 | 0.201 | 0.050 | 0.000 | 0.024 | 0.459 | 0.266 | 0.000 | ||
| 1 spectrum, TEASIDDFIQSVER | 0.000 | 0.002 | 0.000 | 0.156 | 0.000 | 0.842 | 0.000 | 0.000 | ||
| 1 spectrum, IHPFVR | 0.000 | 0.000 | 0.000 | 0.162 | 0.000 | 0.838 | 0.000 | 0.000 | ||
| 4 spectra, VAILVSGR | 0.000 | 0.000 | 0.000 | 0.281 | 0.000 | 0.719 | 0.000 | 0.000 | ||
| 1 spectrum, YSPLMVYK | 0.000 | 0.140 | 0.173 | 0.000 | 0.452 | 0.076 | 0.160 | 0.000 | ||
| 1 spectrum, VLLELEMK | 0.000 | 0.146 | 0.026 | 0.225 | 0.268 | 0.335 | 0.000 | 0.000 | ||
| 1 spectrum, NLSGGQK | 0.000 | 0.000 | 0.000 | 0.115 | 0.000 | 0.885 | 0.000 | 0.000 | ||
| 2 spectra, VWFQLR | 0.000 | 0.000 | 0.000 | 0.216 | 0.082 | 0.702 | 0.000 | 0.000 | ||
| 2 spectra, QNIALEVDASGAR | 0.000 | 0.150 | 0.000 | 0.045 | 0.151 | 0.654 | 0.000 | 0.000 | ||
| 4 spectra, FQFGQR | 0.000 | 0.145 | 0.000 | 0.077 | 0.139 | 0.574 | 0.065 | 0.000 | ||
| 2 spectra, LSEMADLESVFR | 0.000 | 0.000 | 0.000 | 0.282 | 0.037 | 0.682 | 0.000 | 0.000 | ||
| 3 spectra, NIQDILAR | 0.000 | 0.050 | 0.000 | 0.174 | 0.114 | 0.662 | 0.000 | 0.000 | ||
| 2 spectra, VLGLLDEENIR | 0.000 | 0.000 | 0.000 | 0.180 | 0.000 | 0.820 | 0.000 | 0.000 | ||
| 2 spectra, VAAVPFMAGR | 0.000 | 0.000 | 0.000 | 0.182 | 0.000 | 0.818 | 0.000 | 0.000 |
| Plot | Mito | Lyso or Perox | ER | Golgi | PM | Cytosol | Nucleus | ||||||
| Expt B |
1 peptide |
1 spectrum |
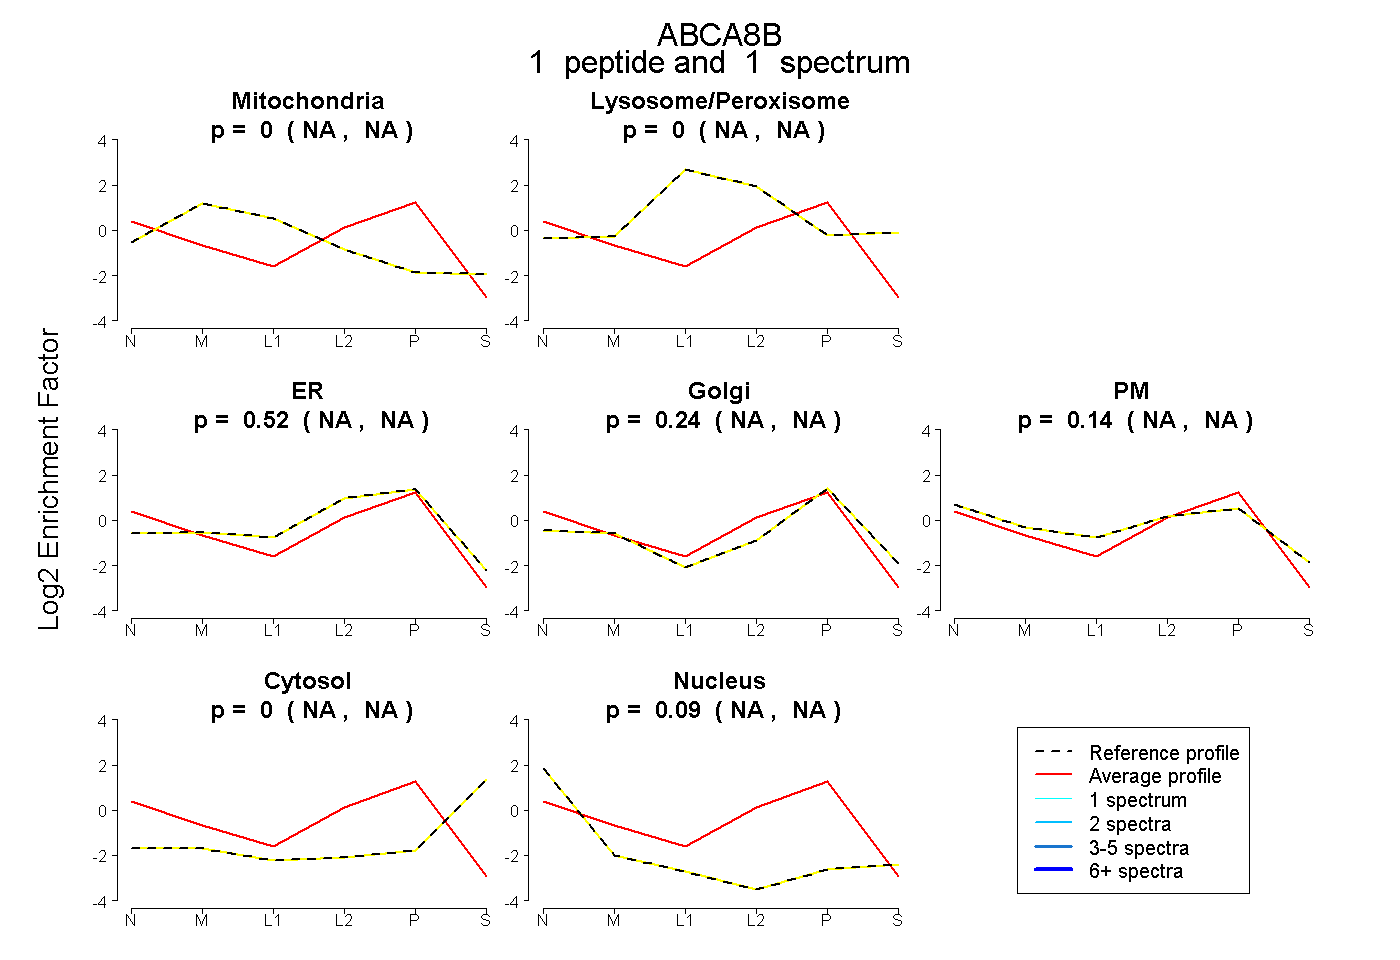 |
0.000 NA | NA |
0.000 NA | NA |
0.520 NA | NA |
0.243 NA | NA |
0.144 NA | NA |
0.000 NA | NA |
0.093 NA | NA |
|||
| Plot | Lyso | Other | |||||||||||
| Expt C |
11 peptides |
20 spectra |
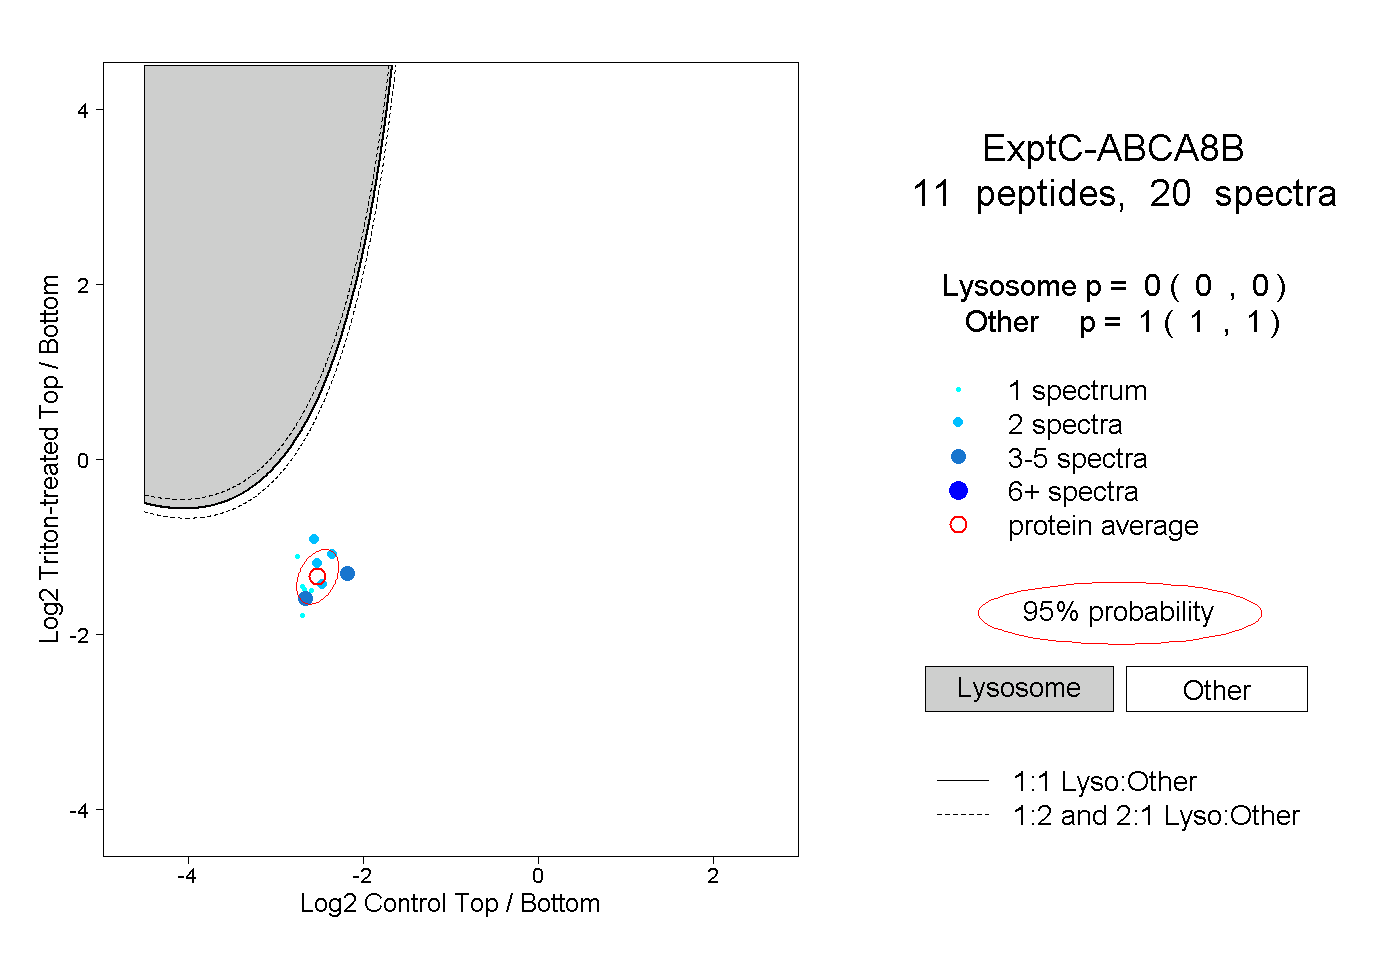 |
0.000 0.000 | 0.000 |
1.000 1.000 | 1.000 |
||||||||
| Plot | Lyso | Other | |||||||||||
| Expt D |
1 peptide |
1 spectrum |
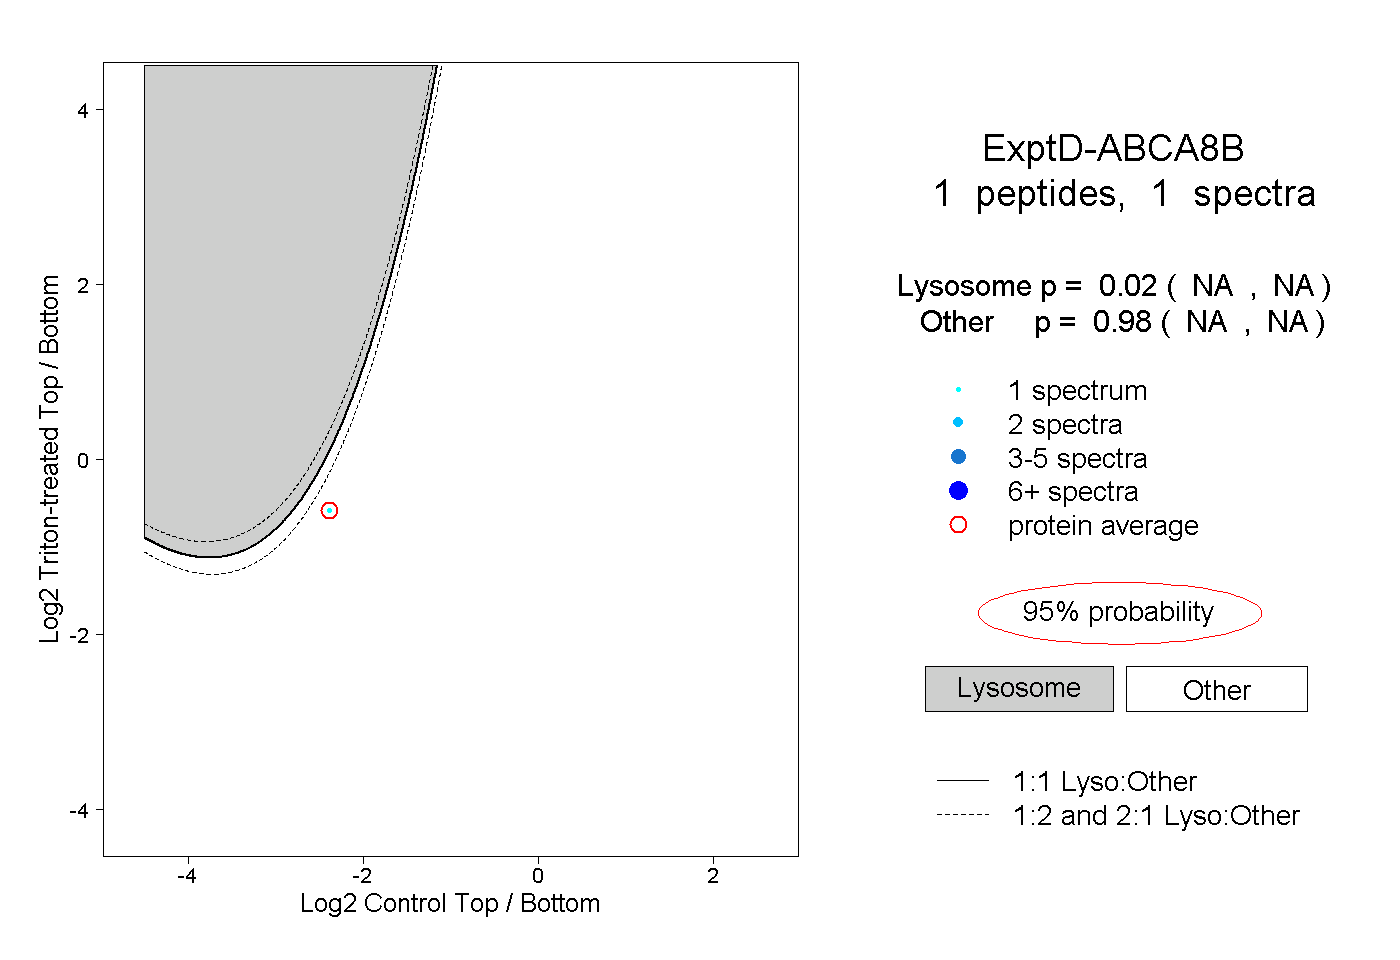 |
0.020 NA | NA |
0.980 NA | NA |