 13
13peptides
spectra
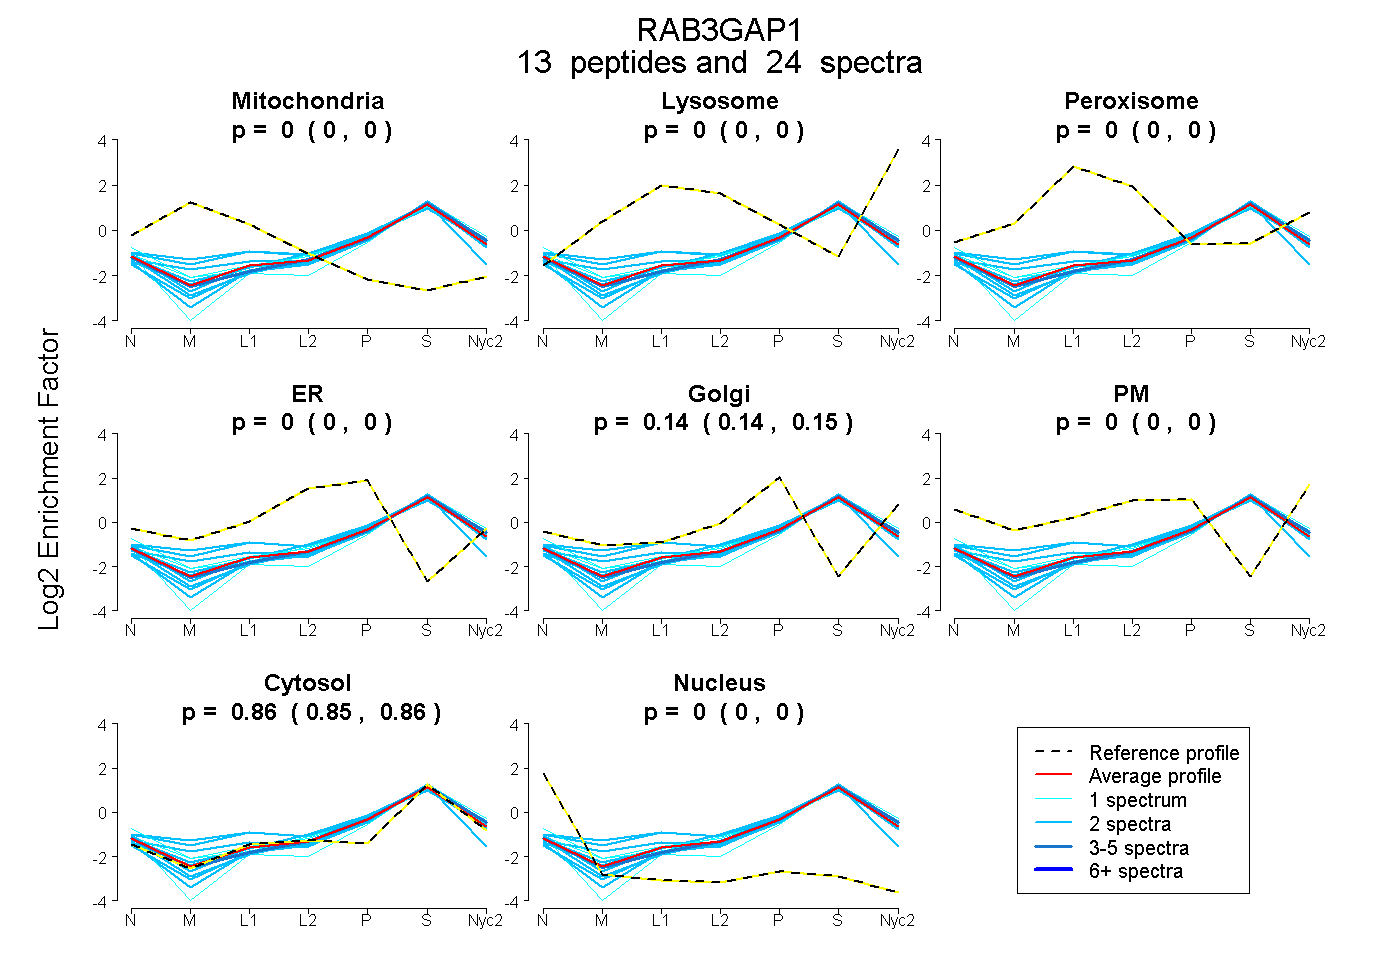
0.000 | 0.000
0.000 | 0.000
0.000 | 0.000
0.000 | 0.000
0.139 | 0.148
0.000 | 0.000
0.851 | 0.860
0.000 | 0.000
4peptides
spectra
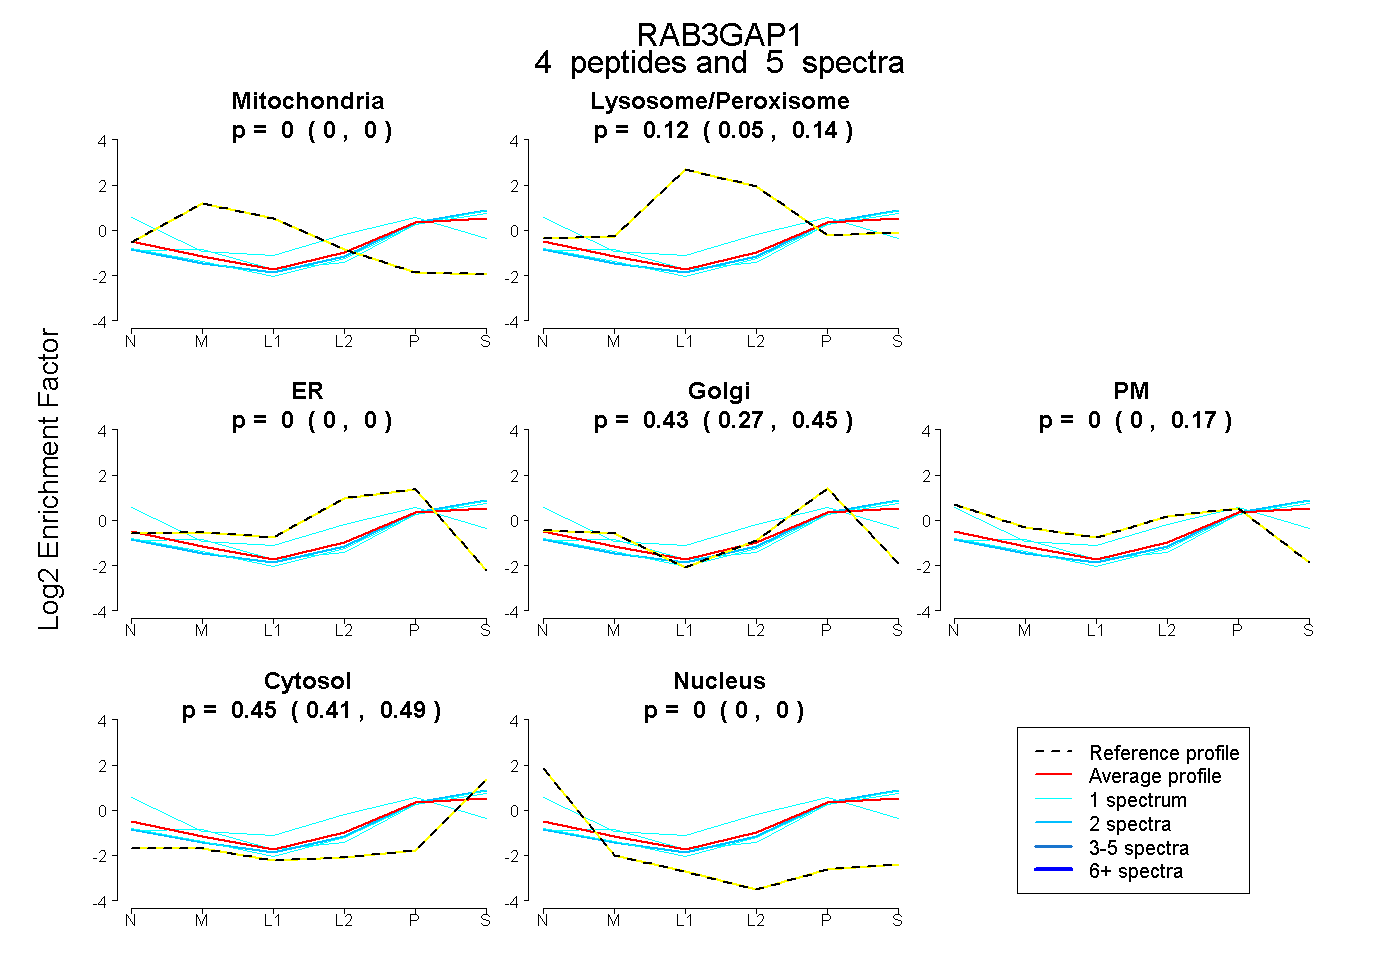
0.000 | 0.000
0.049 | 0.142
0.000 | 0.000
0.273 | 0.453
0.000 | 0.167
0.413 | 0.489
0.000 | 0.000
7peptides
spectra
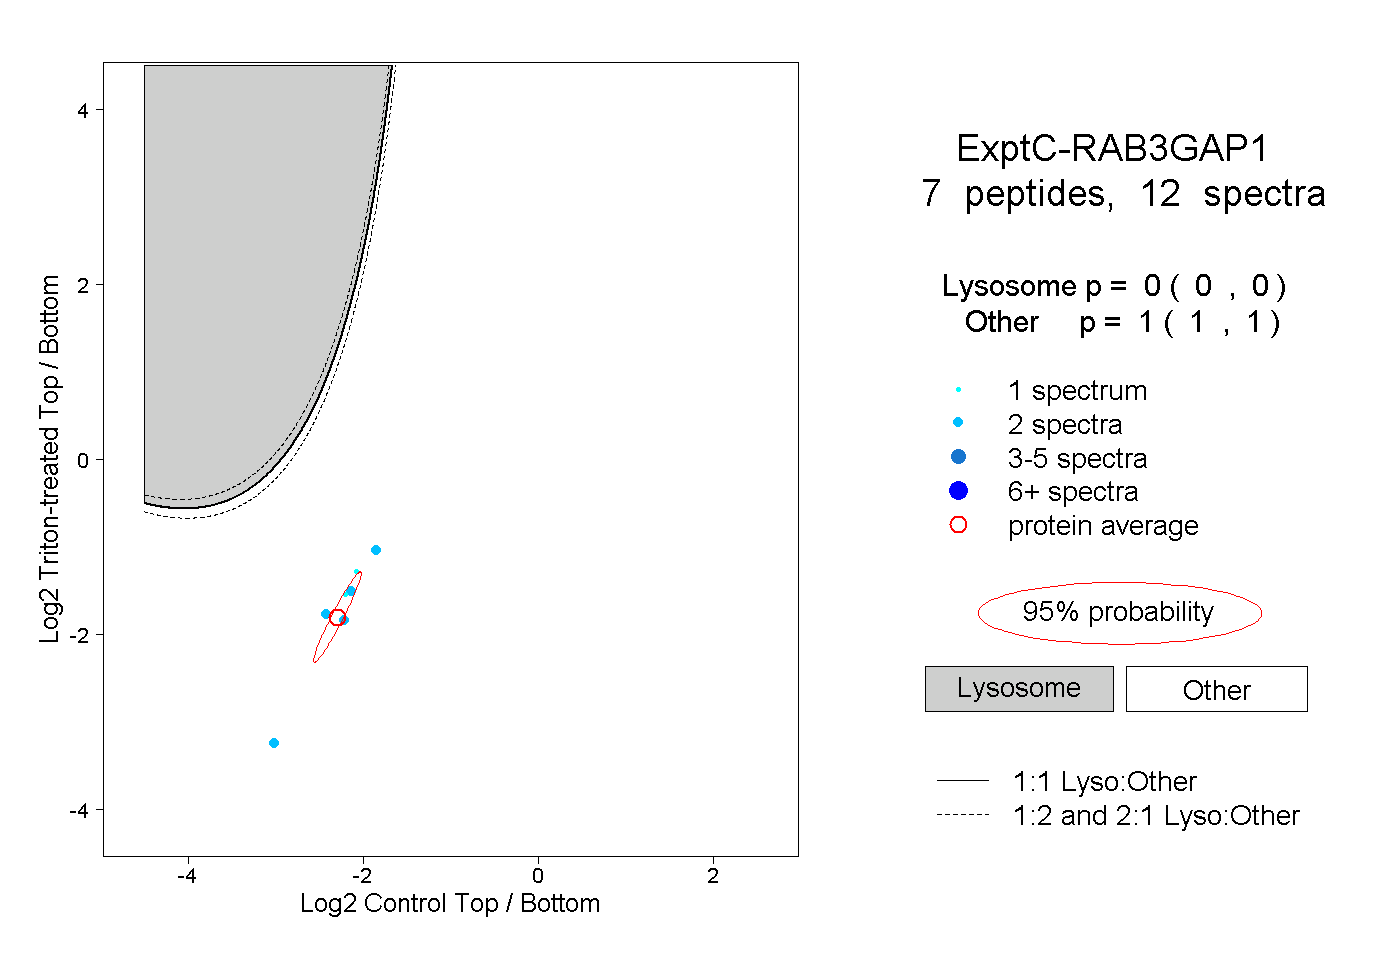
0.000 | 0.000
1.000 | 1.000