RAB3GAP1
[ENSRNOP00000005289]
Main page
| | | Plot |
Mito |
Lyso |
|
Perox |
ER |
Golgi |
PM |
Cytosol |
Nucleus |
|
| Expt A |
 13
13
peptides |
24
spectra |
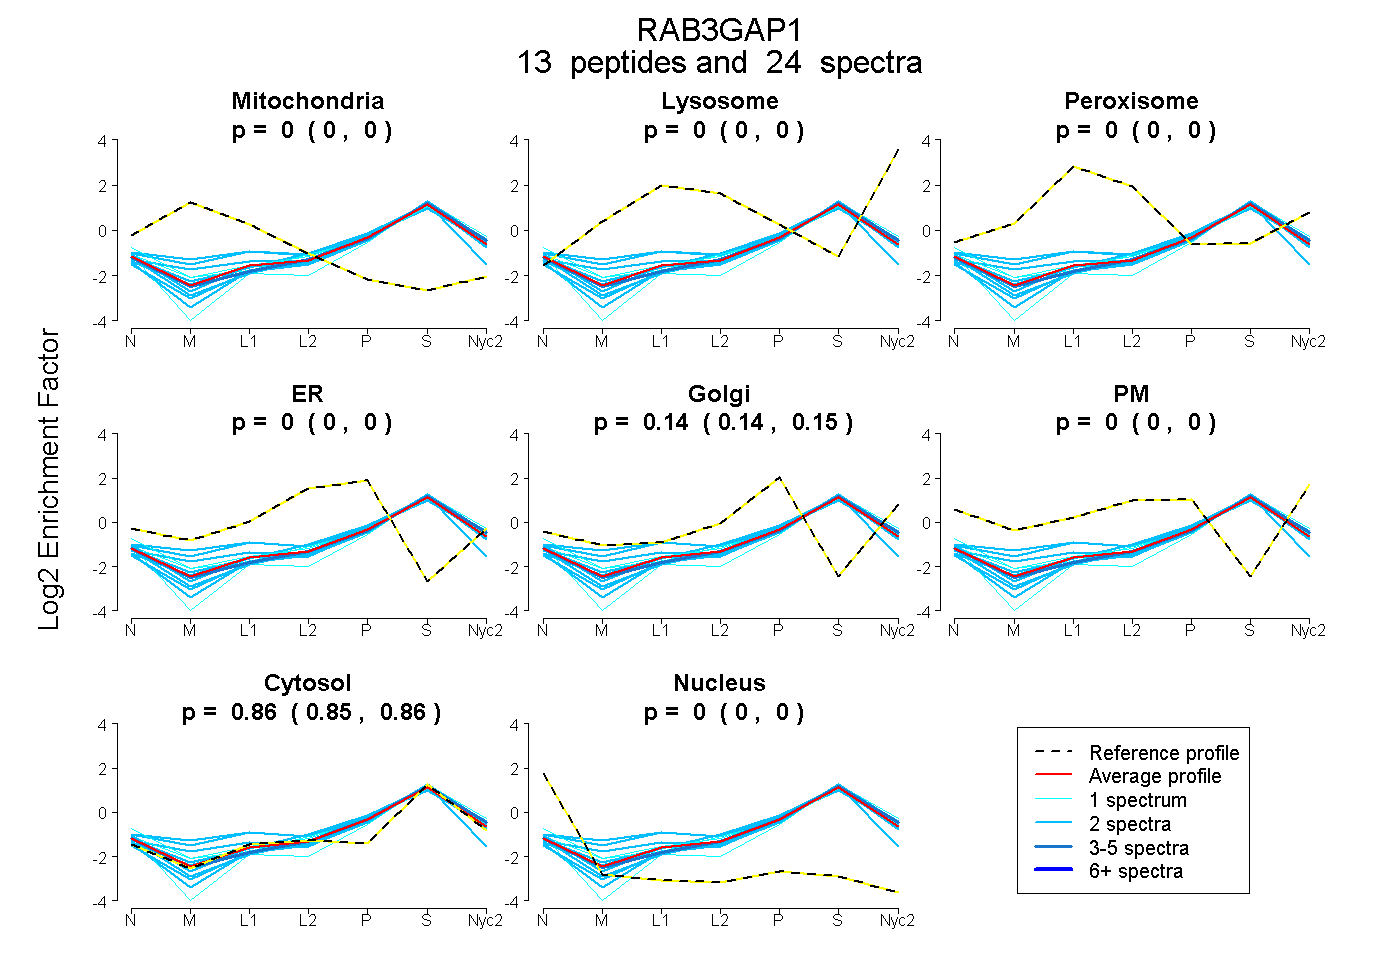 |
0.000
0.000 | 0.000 |
0.000
0.000 | 0.000 |
|
0.000
0.000 | 0.000 |
0.000
0.000 | 0.000 |
0.144
0.139 | 0.148 |
0.000
0.000 | 0.000 |
0.856
0.851 | 0.860 |
0.000
0.000 | 0.000 |
|
| | | Plot |
Mito |
|
Lyso or Perox |
|
ER |
Golgi |
PM |
Cytosol |
Nucleus |
|
| Expt B |
4
peptides |
5
spectra |
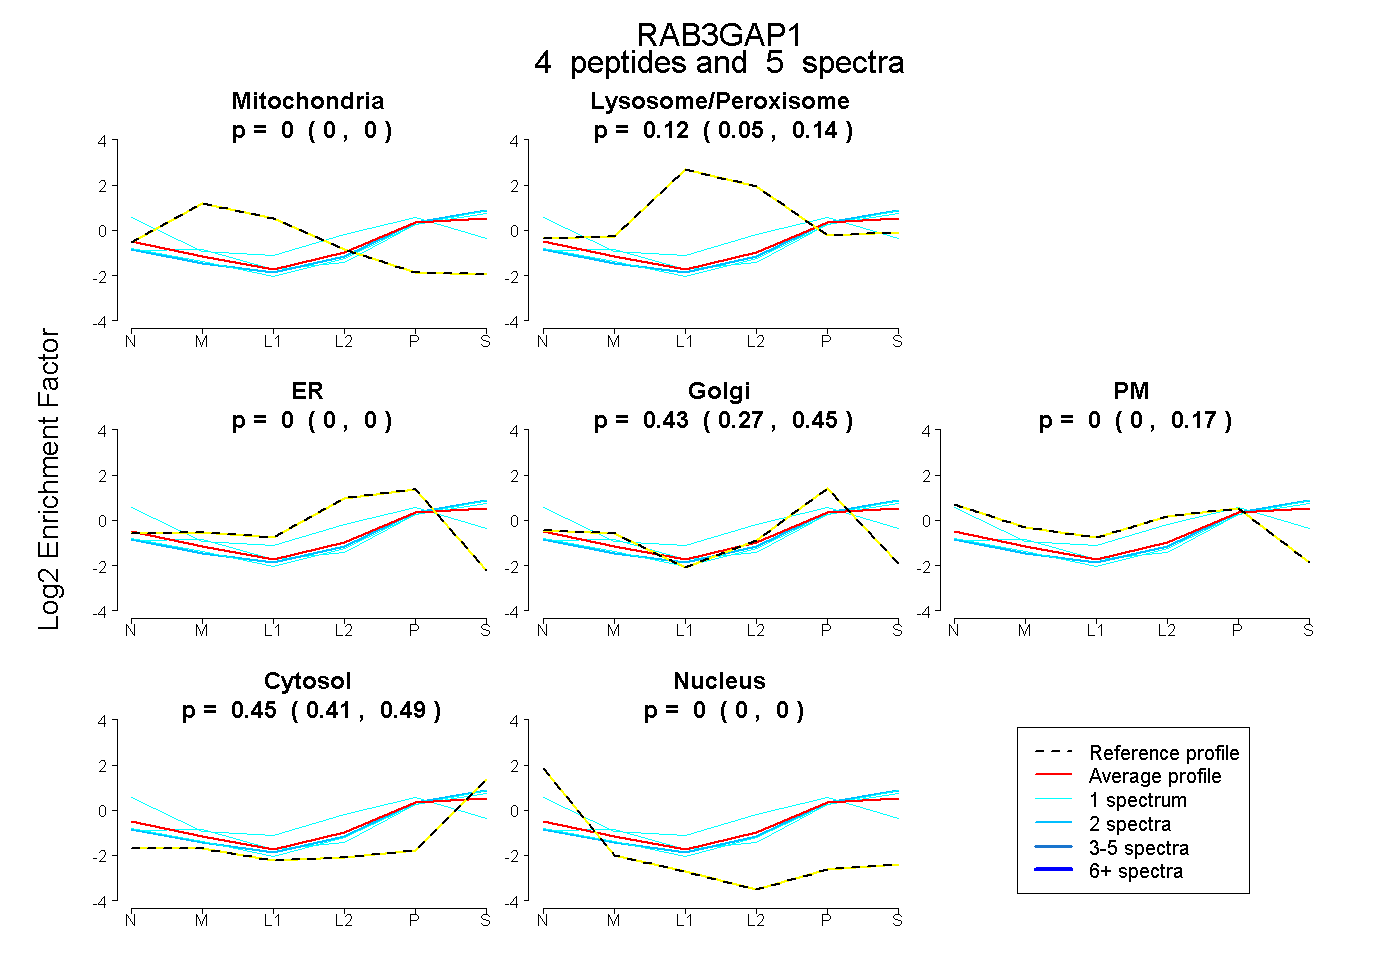 |
0.000
0.000 | 0.000 |
|
0.120
0.049 | 0.142 |
|
0.000
0.000 | 0.000 |
0.428
0.273 | 0.453 |
0.000
0.000 | 0.167 |
0.452
0.413 | 0.489 |
0.000
0.000 | 0.000 |
|
| 2 spectra, LFVNAQR |
0.000 |
|
0.087 |
|
0.000 |
0.370 |
0.000 |
0.544 |
0.000 |
|
| 1 spectrum, ESTDEILGR |
0.000 |
|
0.091 |
|
0.000 |
0.382 |
0.000 |
0.526 |
0.000 |
|
| 1 spectrum, QIIAHSSK |
0.000 |
|
0.052 |
|
0.000 |
0.035 |
0.685 |
0.228 |
0.000 |
|
| 1 spectrum, VEEVLNDWK |
0.000 |
|
0.058 |
|
0.000 |
0.380 |
0.000 |
0.562 |
0.000 |
|
| | | Plot |
|
Lyso |
|
|
|
|
|
|
|
Other |
| Expt C |
7
peptides |
12
spectra |
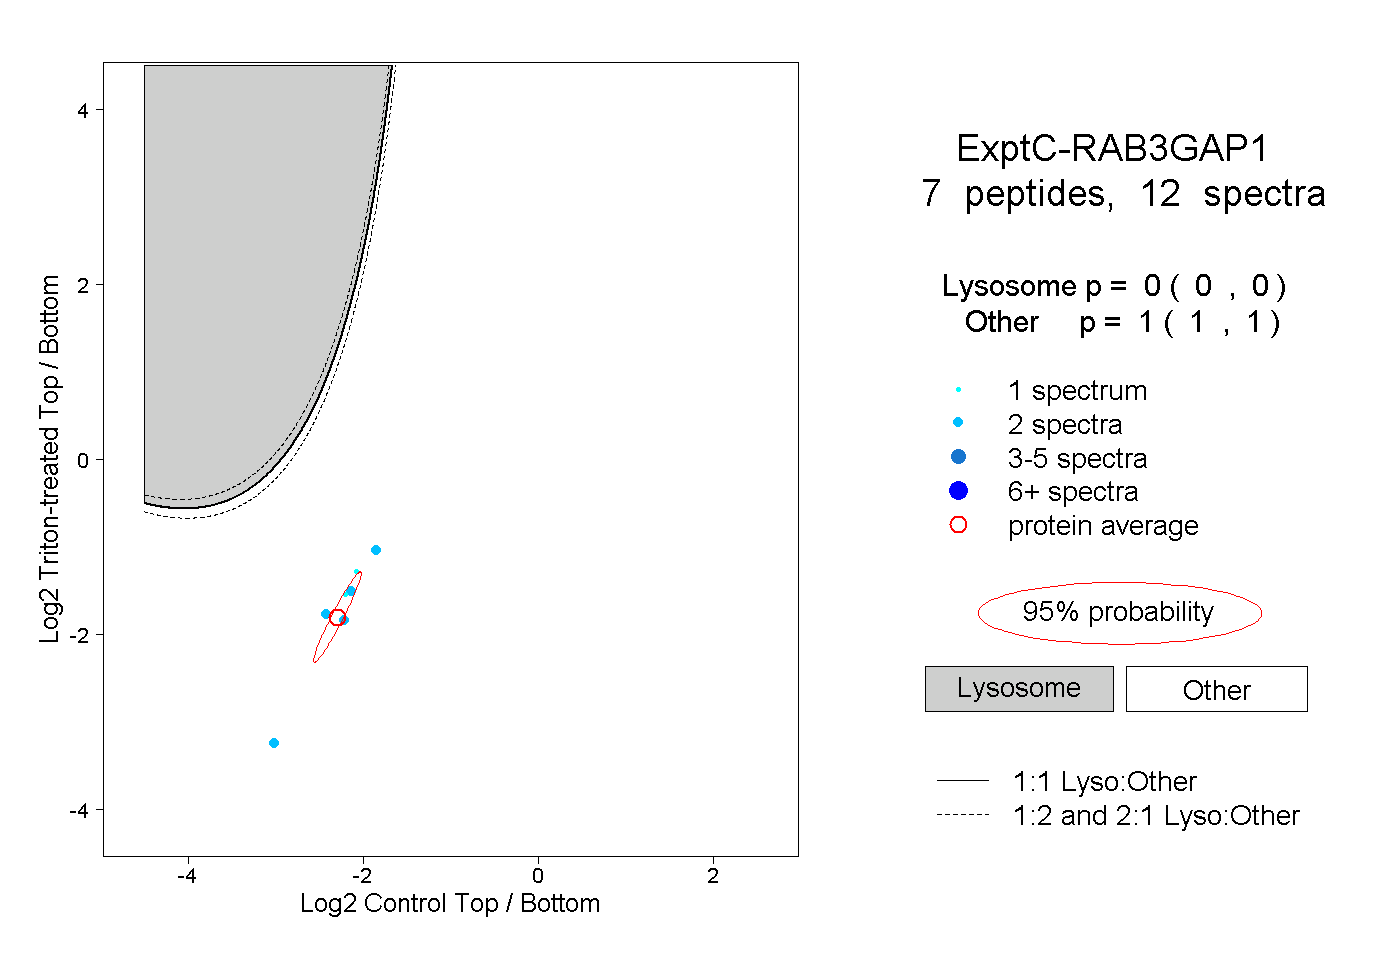 |
|
0.000
0.000 | 0.000 |
|
|
|
|
|
|
|
1.000
1.000 | 1.000 |