 12
12peptides
spectra
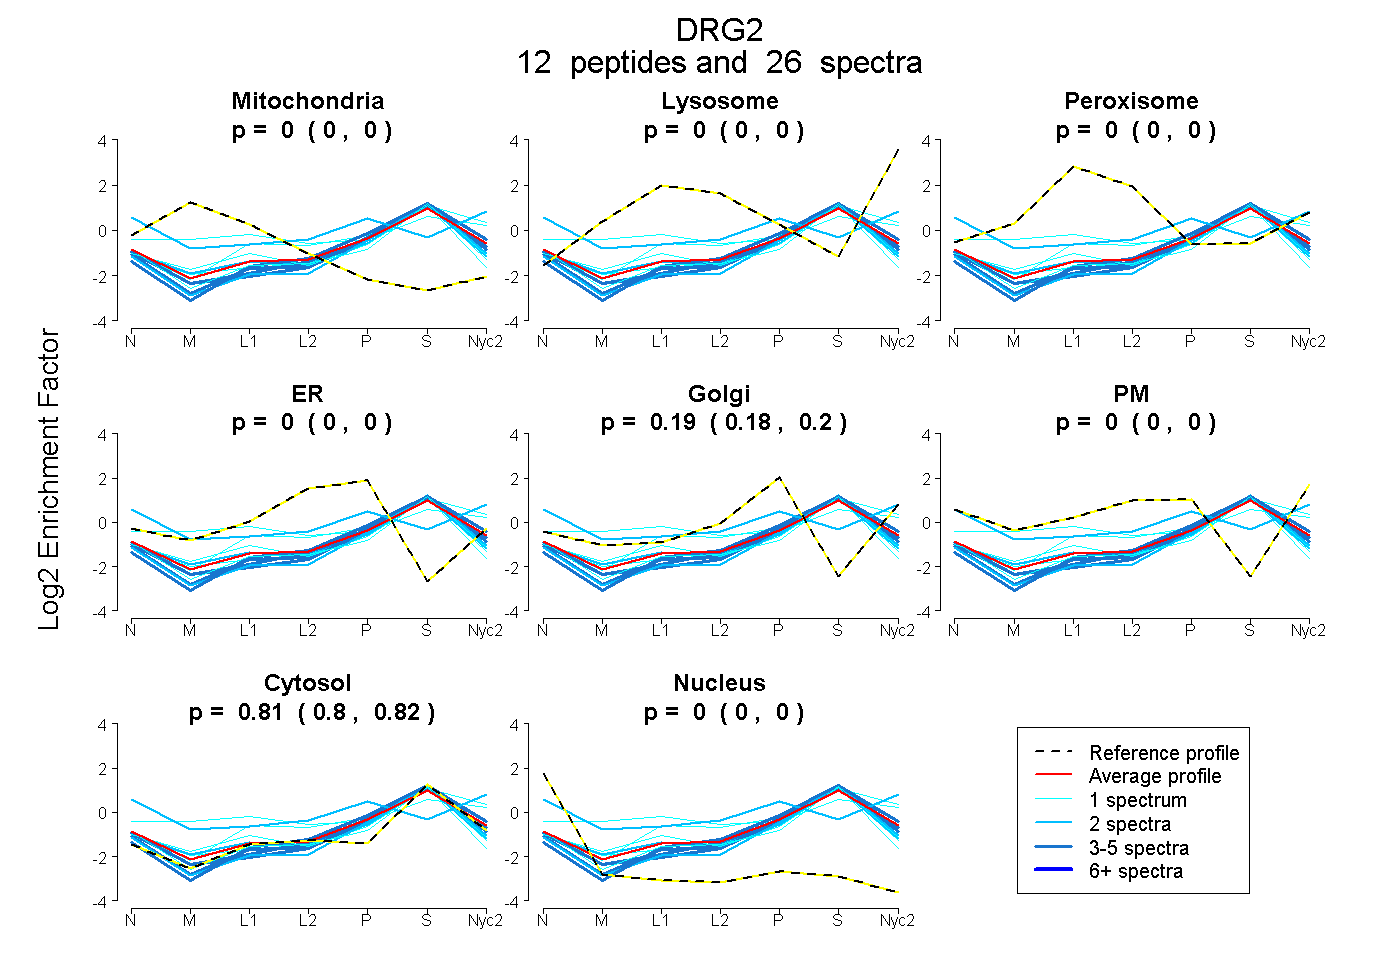
0.000 | 0.000
0.000 | 0.000
0.000 | 0.000
0.000 | 0.000
0.179 | 0.196
0.000 | 0.000
0.802 | 0.819
0.000 | 0.002
3peptides
spectra
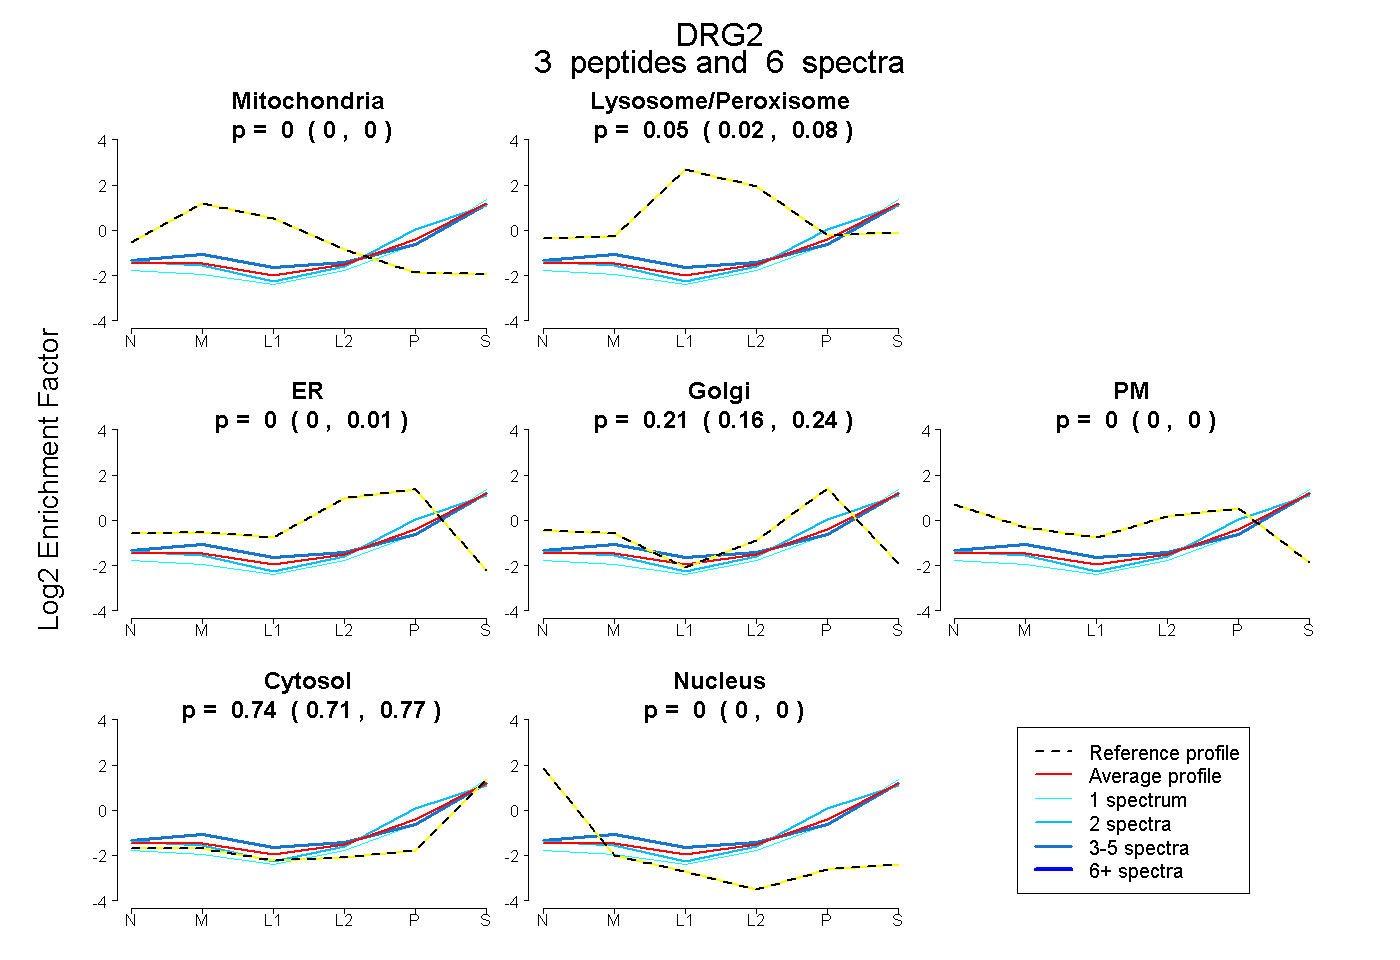
0.000 | 0.000
0.019 | 0.082
0.000 | 0.007
0.160 | 0.237
0.000 | 0.000
0.712 | 0.766
0.000 | 0.000
10peptides
spectra
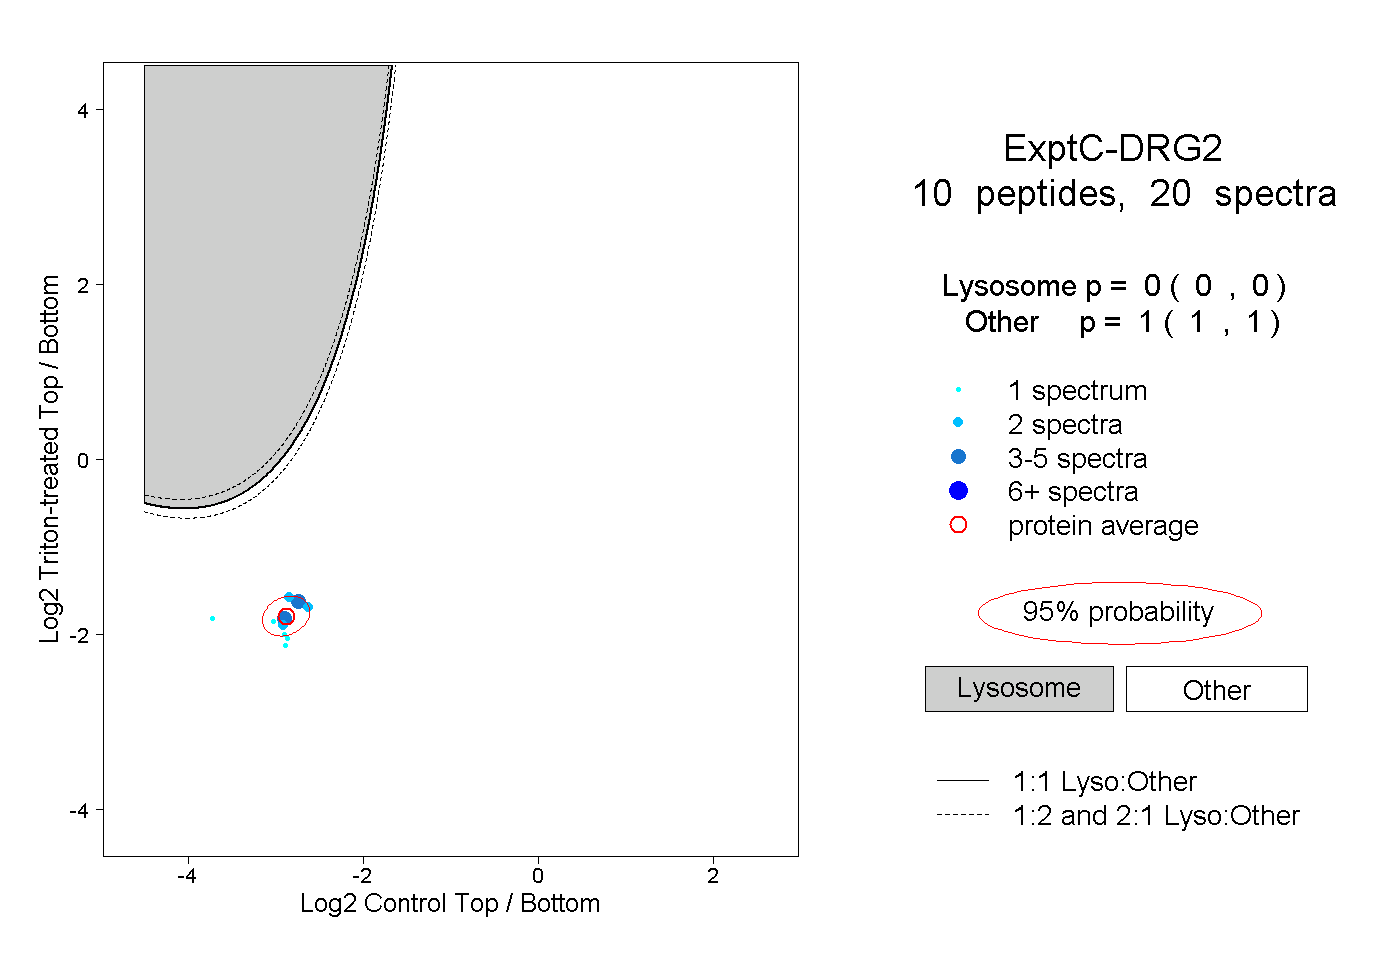
0.000 | 0.000
1.000 | 1.000