 7
7peptides
spectra
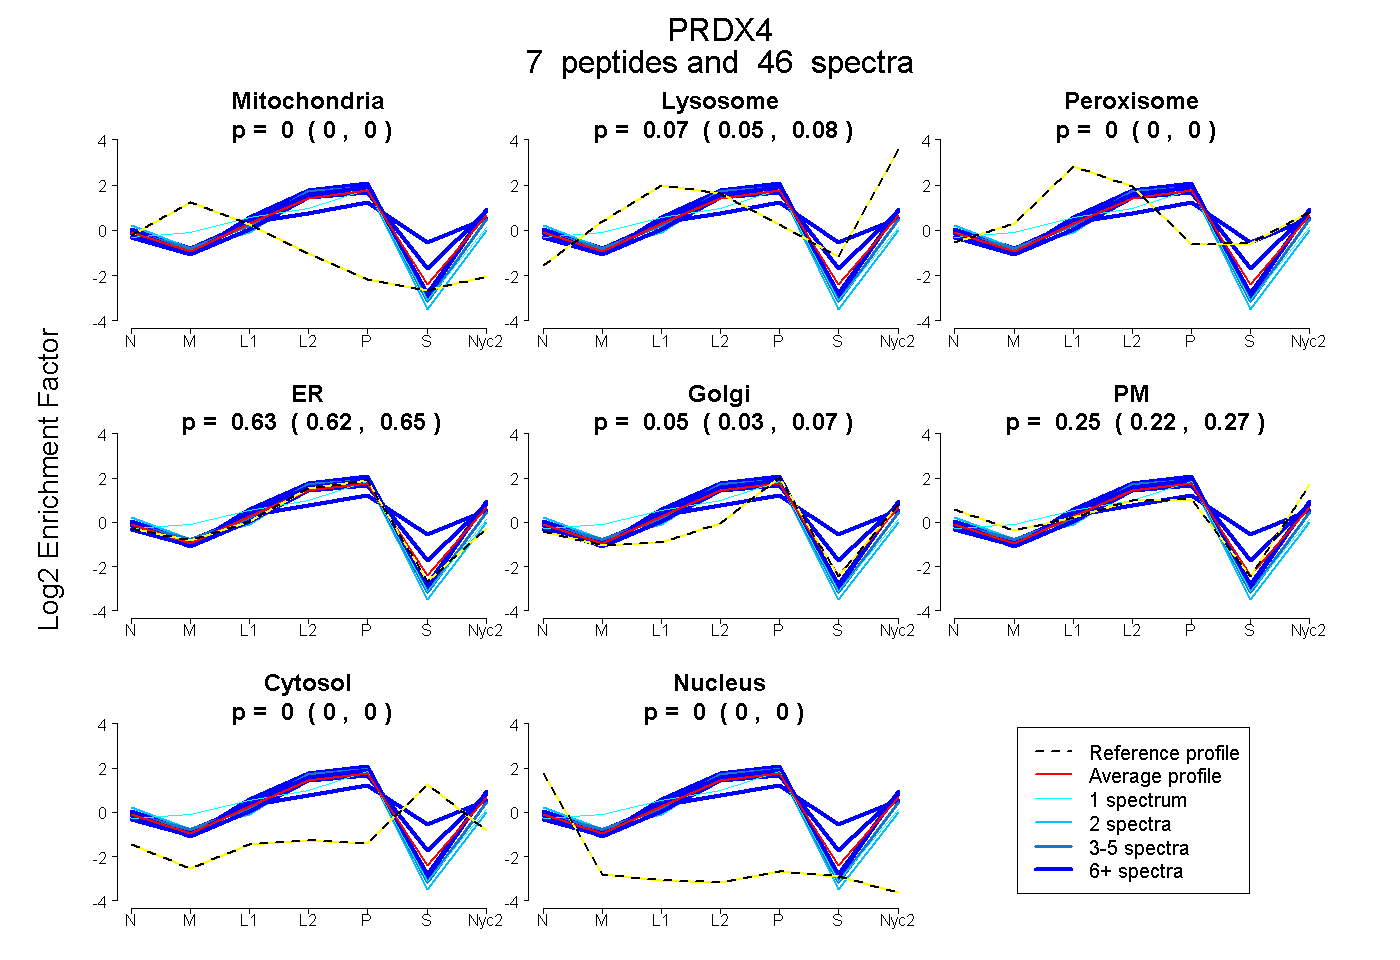
0.000 | 0.000
0.055 | 0.080
0.000 | 0.000
0.618 | 0.651
0.028 | 0.066
0.223 | 0.266
0.000 | 0.002
0.000 | 0.000
6peptides
spectra
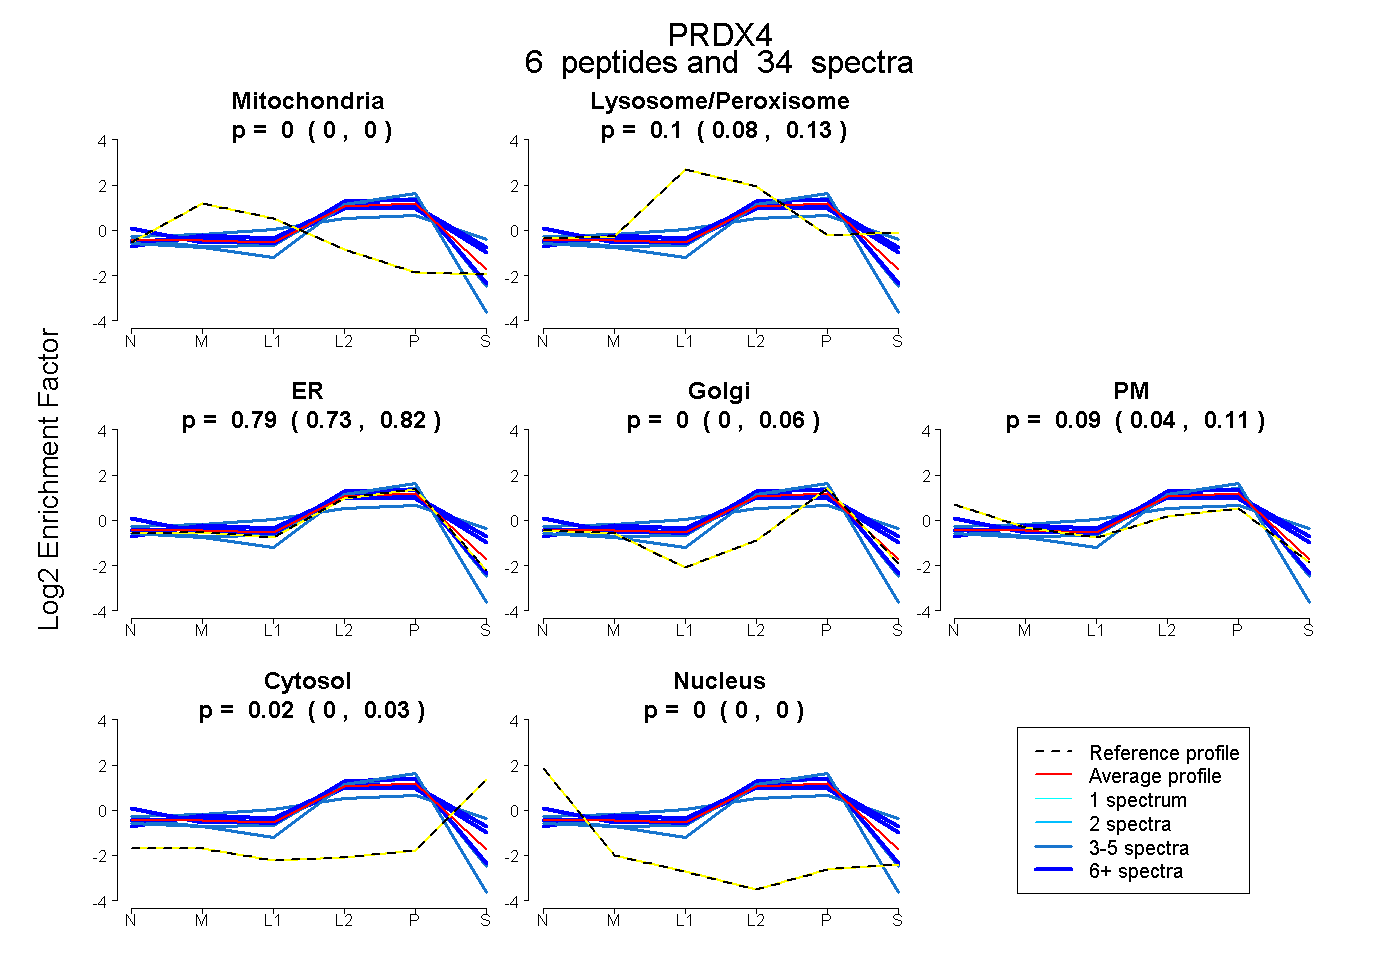
0.000 | 0.000
0.078 | 0.129
0.732 | 0.820
0.000 | 0.062
0.042 | 0.111
0.000 | 0.028
0.000 | 0.000
6peptides
spectra
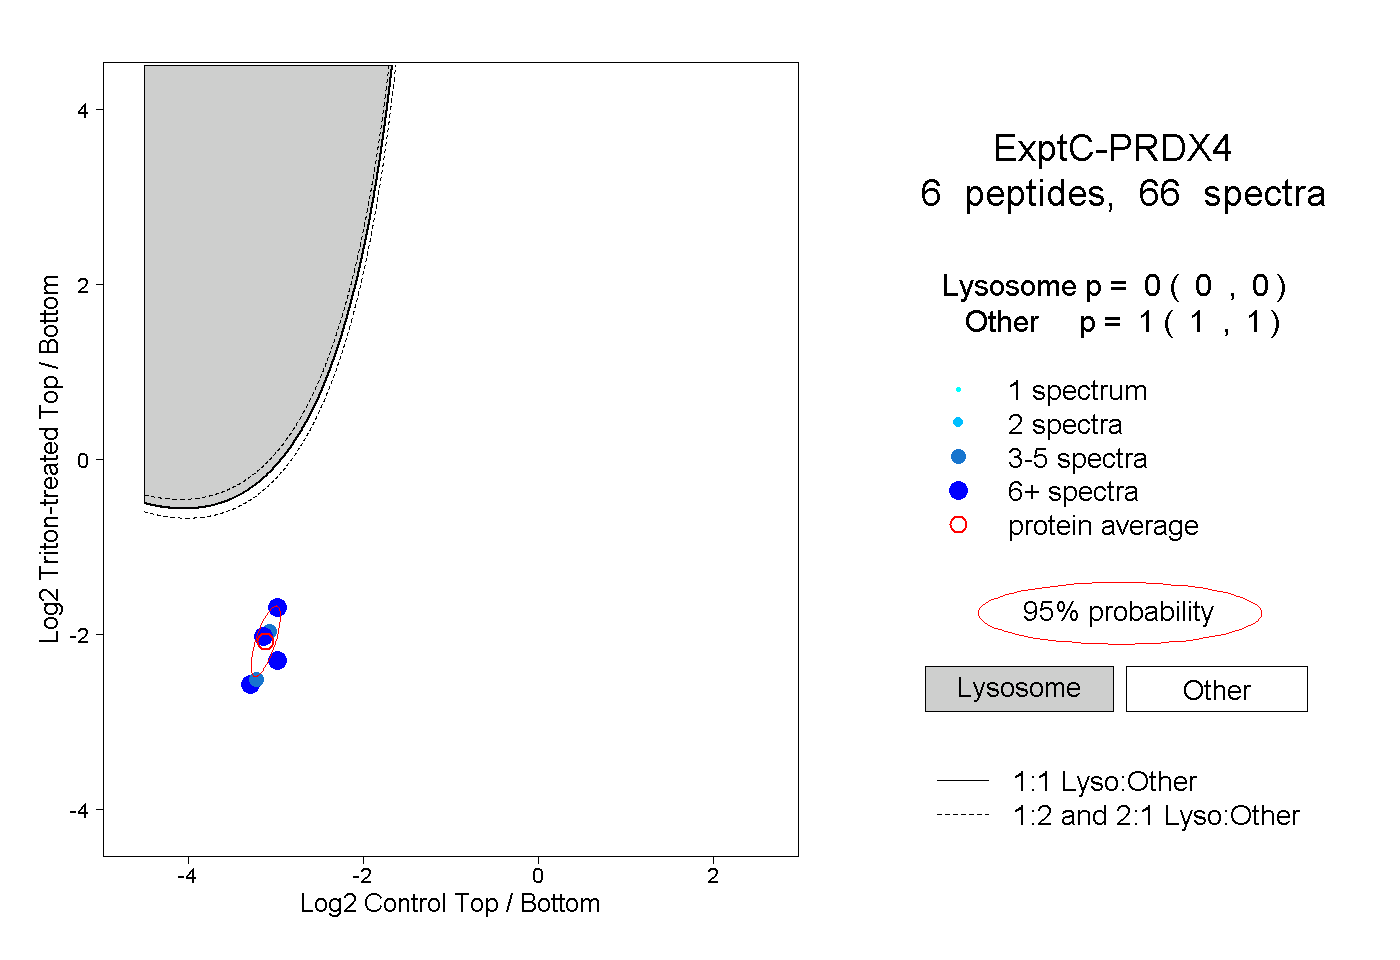
0.000 | 0.000
1.000 | 1.000
3peptides
spectra
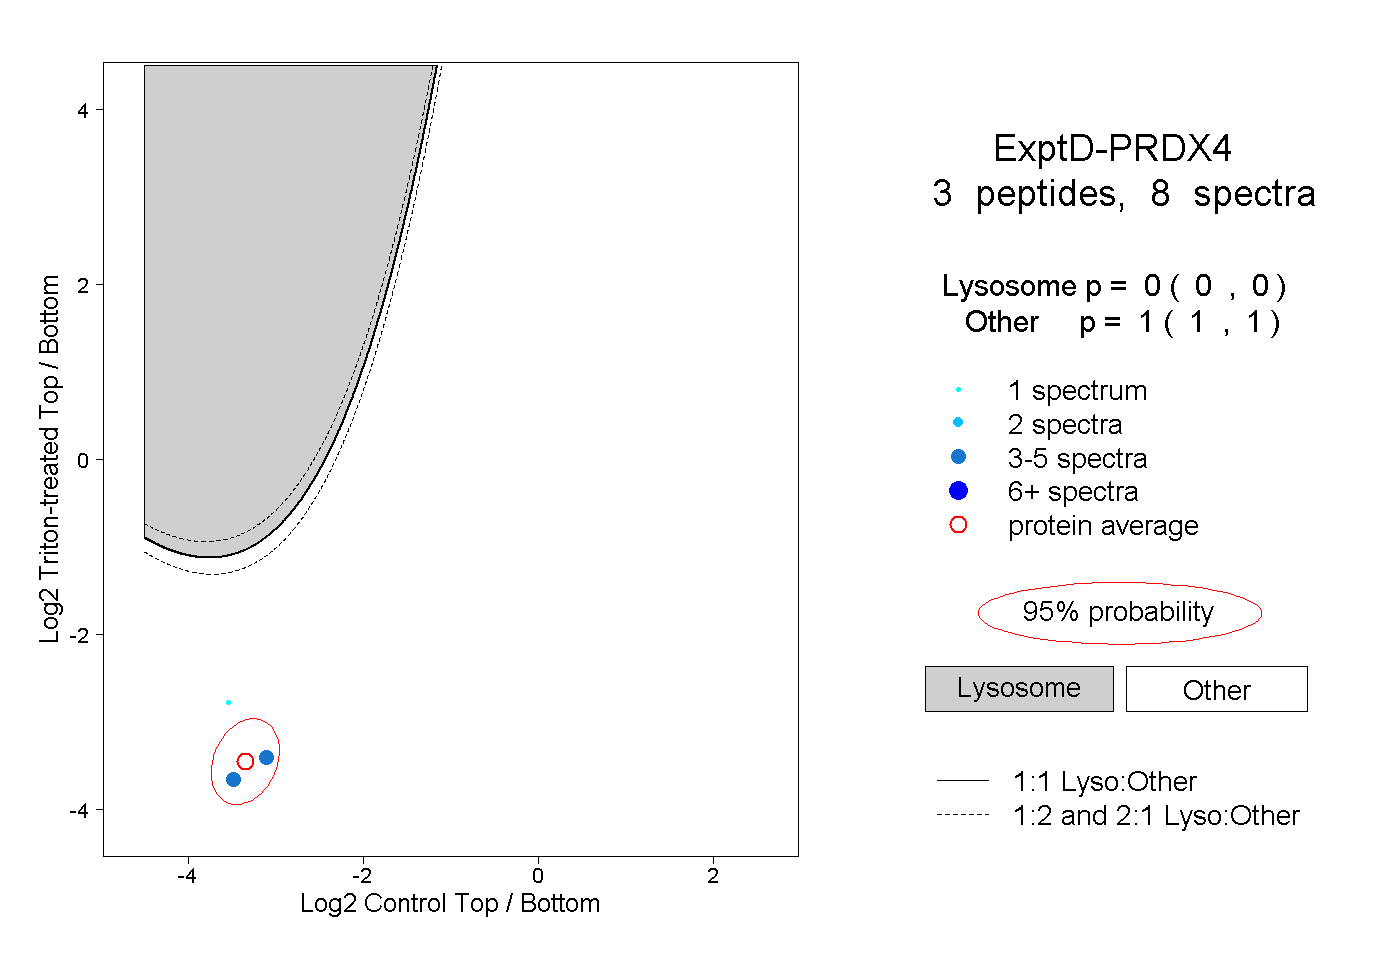
0.000 | 0.000
1.000 | 1.000