 7
7peptides
spectra
0.000 | 0.000
0.055 | 0.080
0.000 | 0.000
0.618 | 0.651
0.028 | 0.066
0.223 | 0.266
0.000 | 0.002
0.000 | 0.000
| Plot | Mito | Lyso | Perox | ER | Golgi | PM | Cytosol | Nucleus | |||||
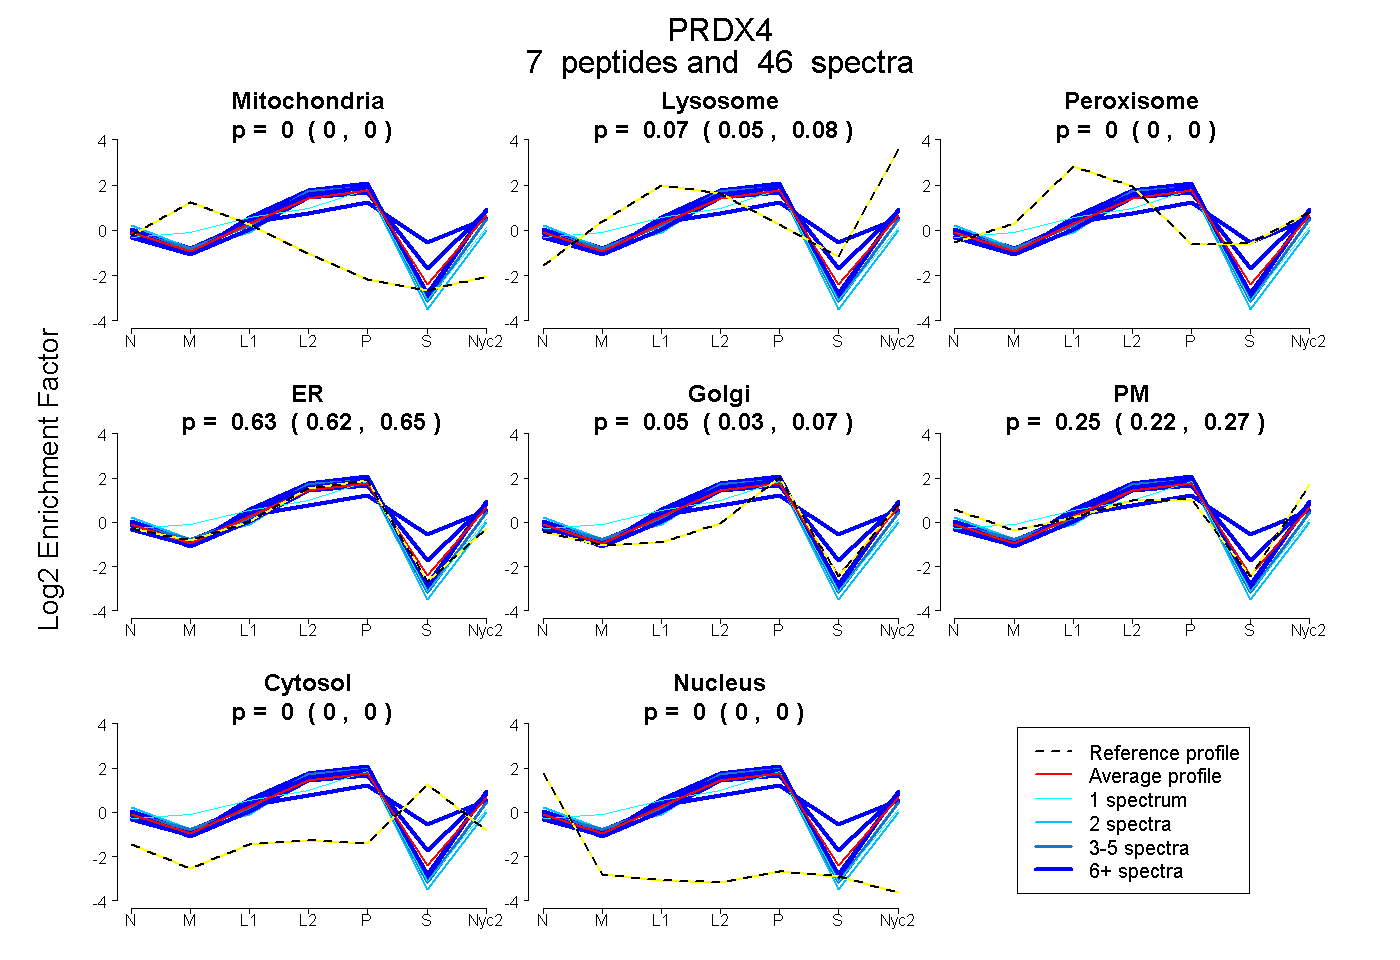
| Expt A |
7 peptides |
46 spectra |
|
0.000 0.000 | 0.000 |
0.069 0.055 | 0.080 |
0.000 0.000 | 0.000 |
0.635 0.618 | 0.651 |
0.050 0.028 | 0.066 |
0.246 0.223 | 0.266 |
0.000 0.000 | 0.002 |
0.000 0.000 | 0.000 |
| 1 spectrum, VSVADHSLHLSK | 0.071 | 0.049 | 0.000 | 0.726 | 0.017 | 0.137 | 0.000 | 0.000 | ||
| 8 spectra, DYGVYLEDSGHTLR | 0.000 | 0.000 | 0.272 | 0.135 | 0.278 | 0.144 | 0.171 | 0.000 | ||
| 8 spectra, QGGLGPIR | 0.000 | 0.112 | 0.000 | 0.532 | 0.075 | 0.209 | 0.073 | 0.000 | ||
| 6 spectra, IPLLSDLNHQISK | 0.000 | 0.127 | 0.000 | 0.726 | 0.000 | 0.147 | 0.000 | 0.000 | ||
| 16 spectra, SVDETLR | 0.000 | 0.053 | 0.000 | 0.614 | 0.000 | 0.332 | 0.000 | 0.000 | ||
| 2 spectra, ENECHFYAGGQVYPGEVSR | 0.000 | 0.000 | 0.000 | 0.856 | 0.000 | 0.135 | 0.000 | 0.009 | ||
| 5 spectra, LVQAFQYTDK | 0.000 | 0.000 | 0.000 | 0.758 | 0.000 | 0.242 | 0.000 | 0.000 |
| Plot | Mito | Lyso or Perox | ER | Golgi | PM | Cytosol | Nucleus | ||||||
| Expt B |
6 peptides |
34 spectra |
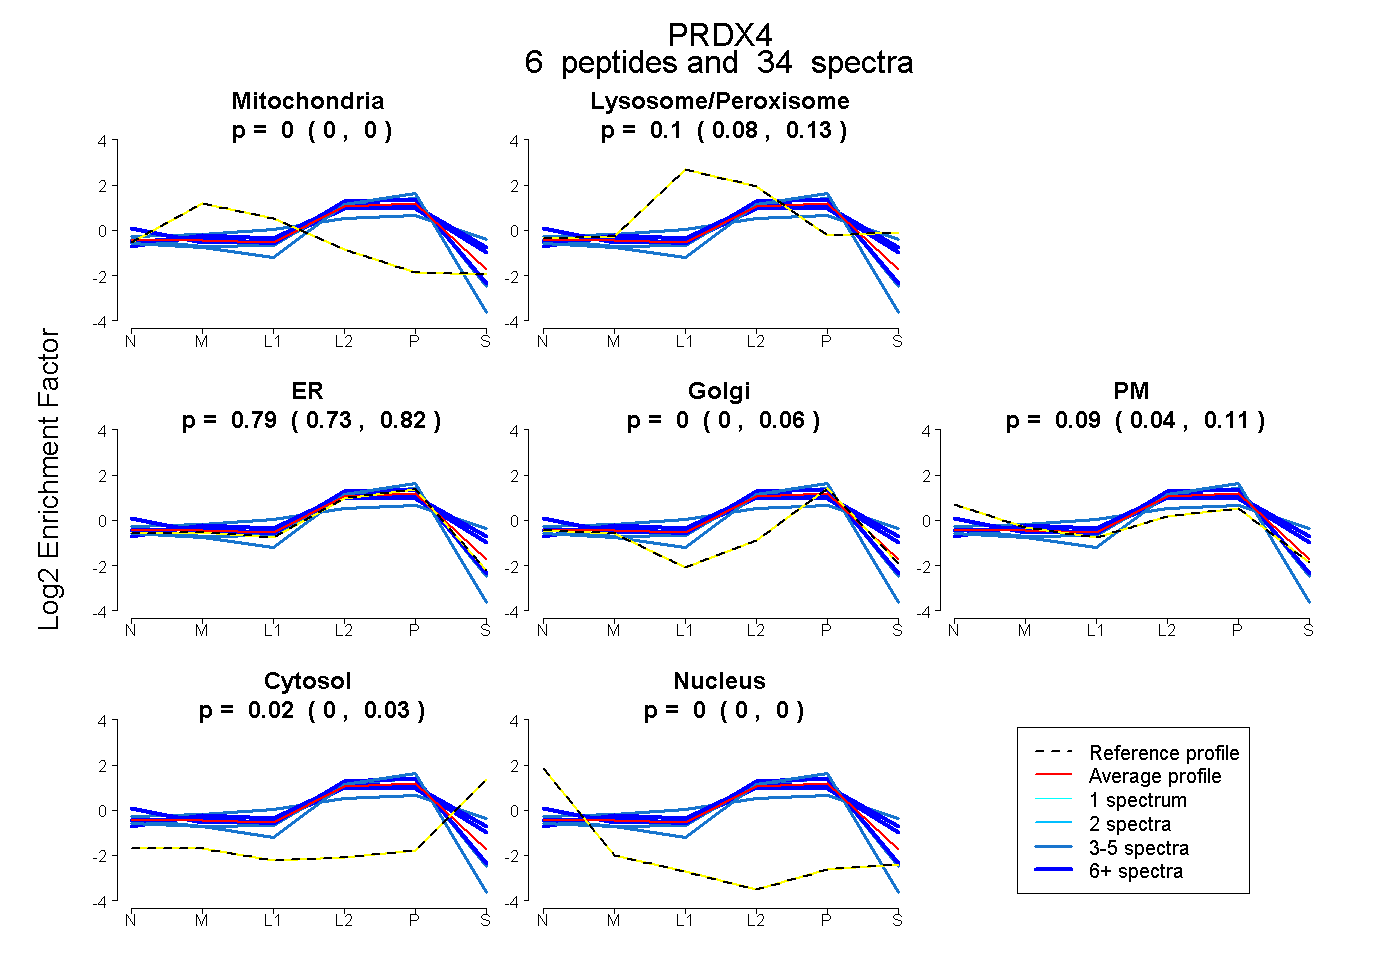 |
0.000 0.000 | 0.000 |
0.097 0.078 | 0.129 |
0.795 0.732 | 0.820 |
0.003 0.000 | 0.062 |
0.088 0.042 | 0.111 |
0.016 0.000 | 0.028 |
0.000 0.000 | 0.000 |
|||
| Plot | Lyso | Other | |||||||||||
| Expt C |
6 peptides |
66 spectra |
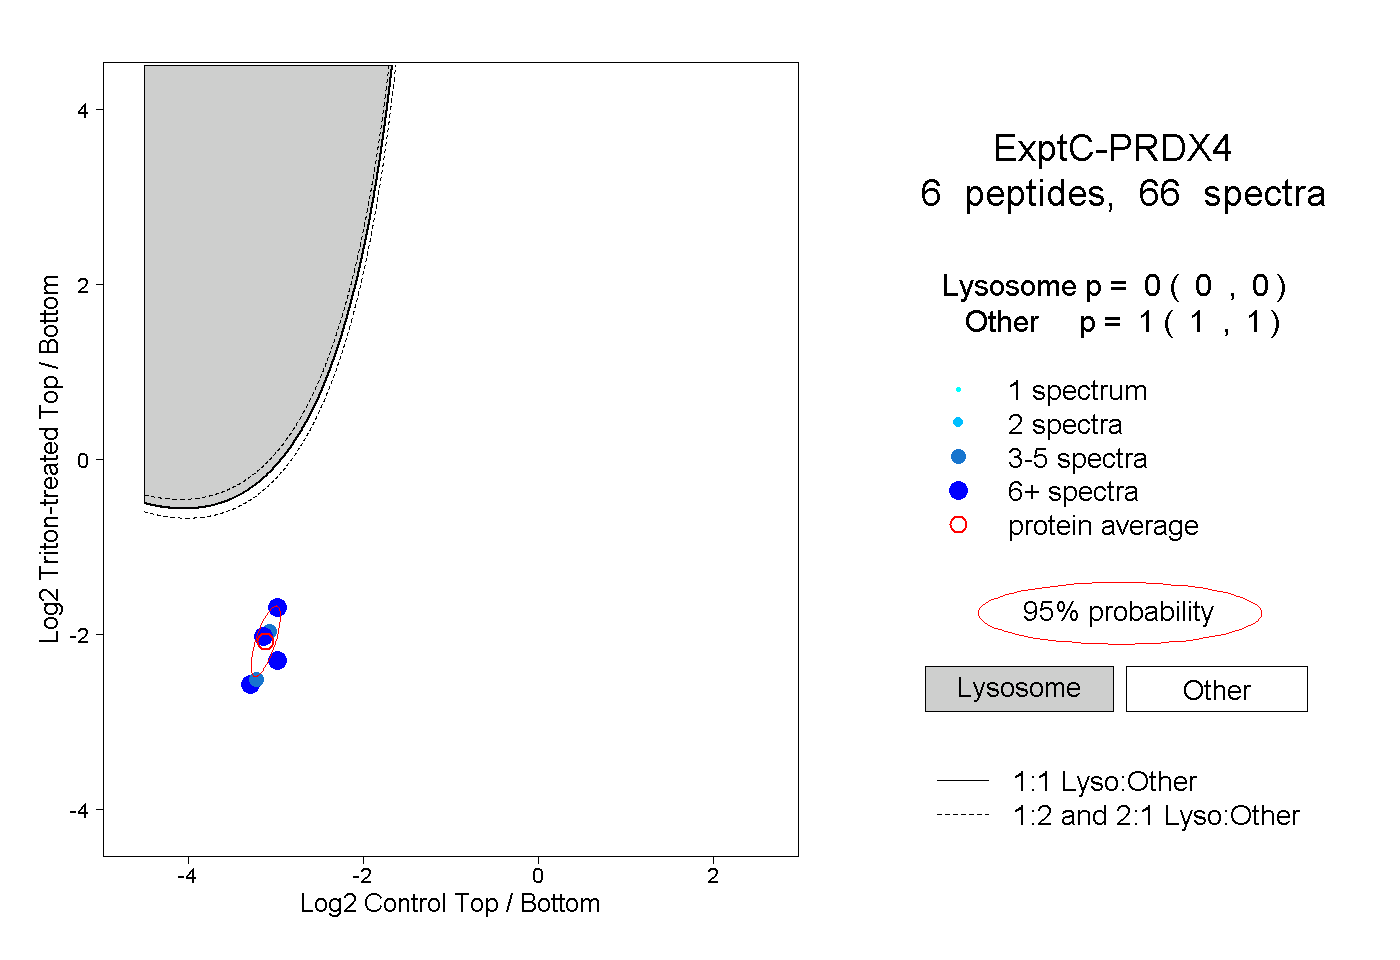 |
0.000 0.000 | 0.000 |
1.000 1.000 | 1.000 |
||||||||
| Plot | Lyso | Other | |||||||||||
| Expt D |
3 peptides |
8 spectra |
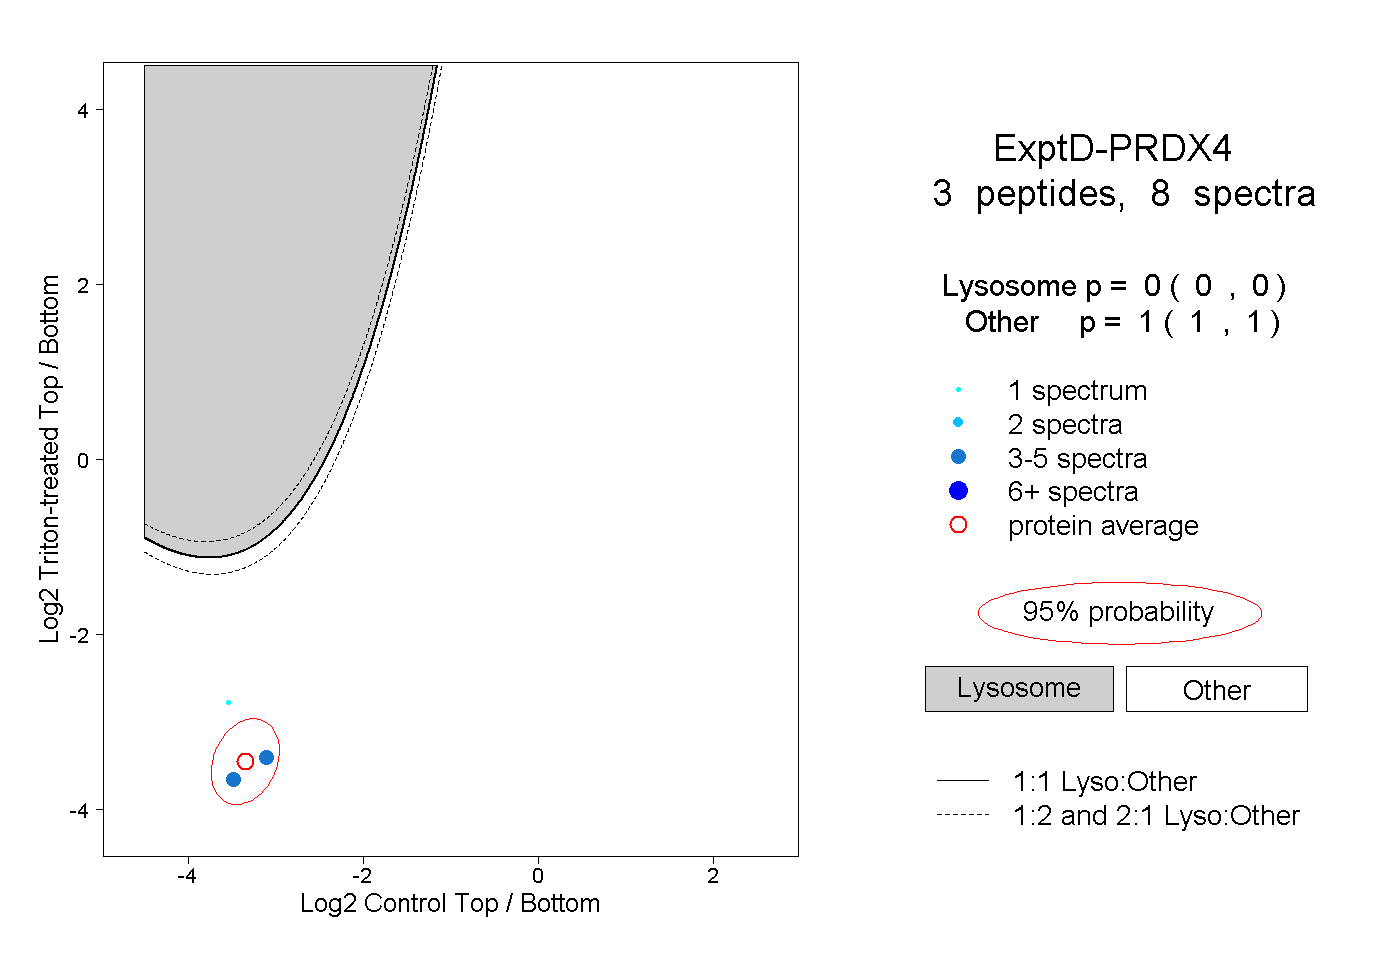 |
0.000 0.000 | 0.000 |
1.000 1.000 | 1.000 |