 6
6peptides
spectra
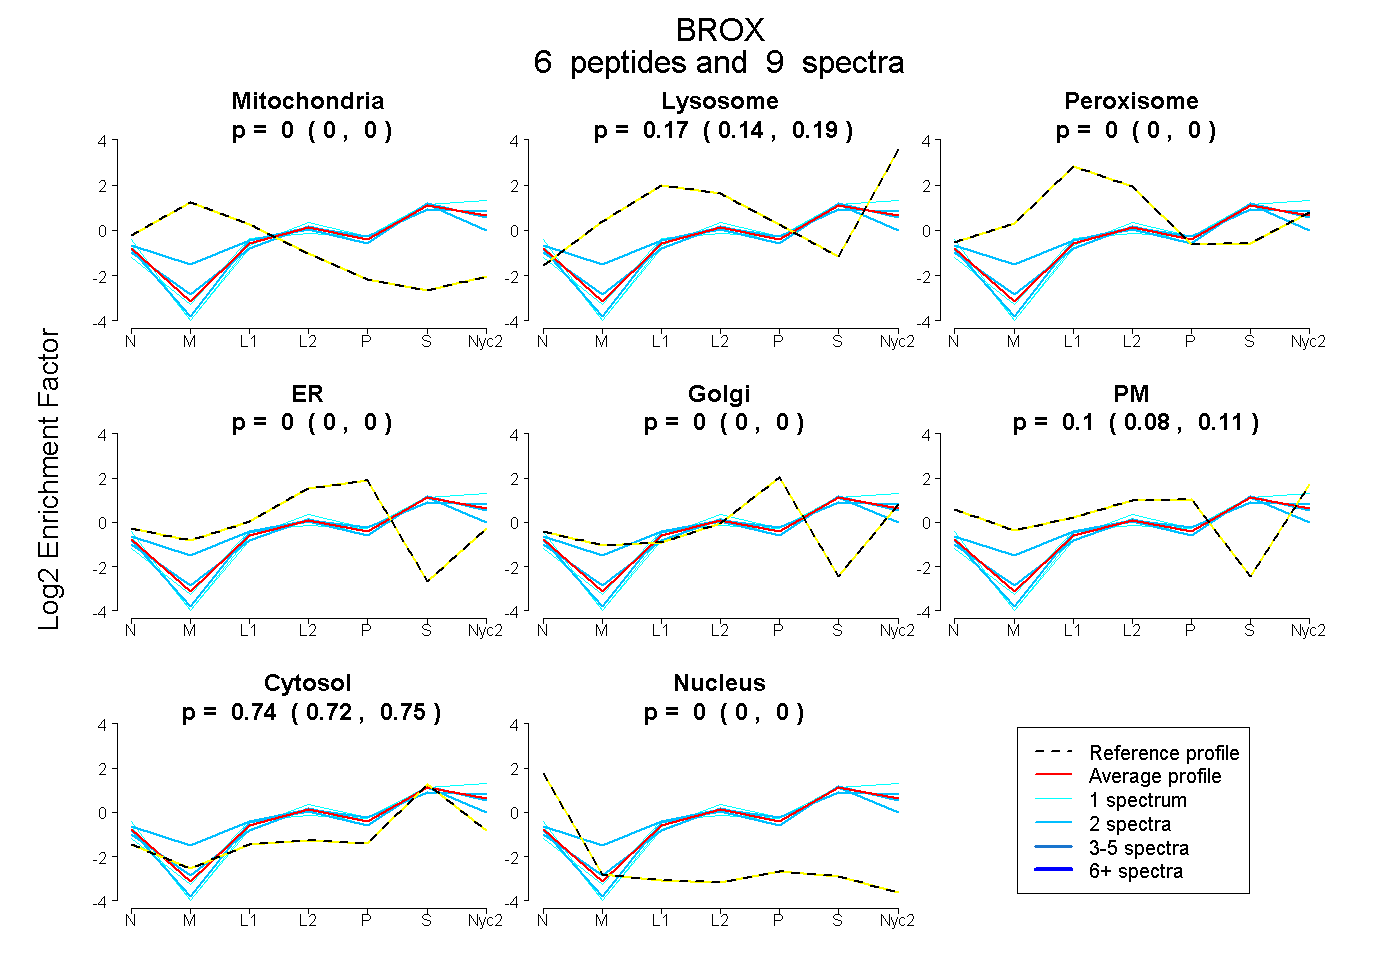
0.000 | 0.000
0.142 | 0.188
0.000 | 0.000
0.000 | 0.002
0.000 | 0.000
0.077 | 0.111
0.719 | 0.750
0.000 | 0.000
9peptides
spectra
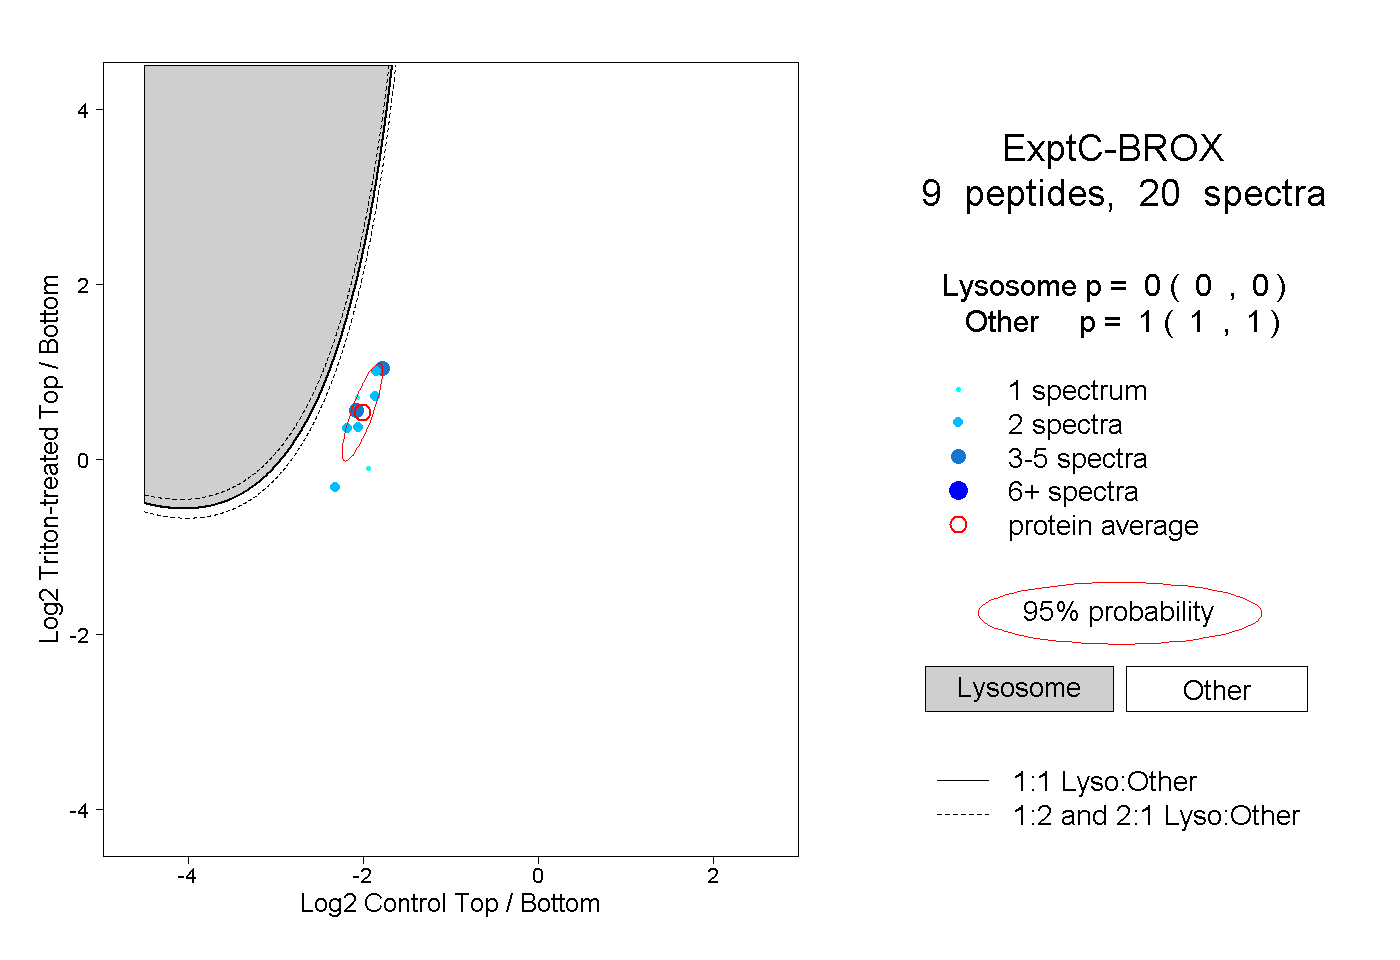
0.000 | 0.000
1.000 | 1.000
2peptides
spectra
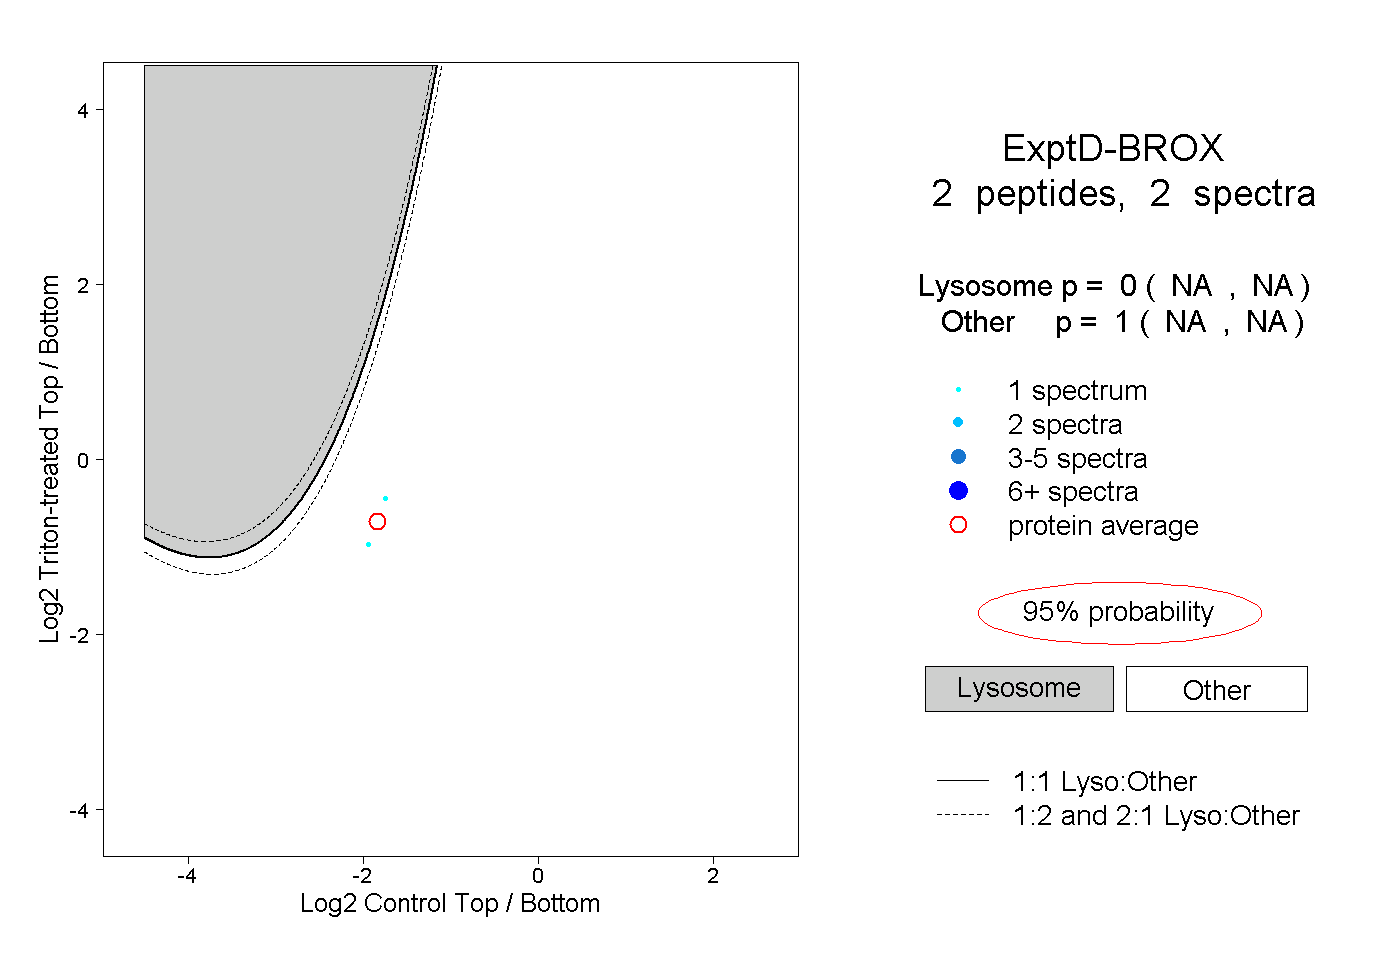
NA | NA
NA | NA