 6
6peptides
spectra
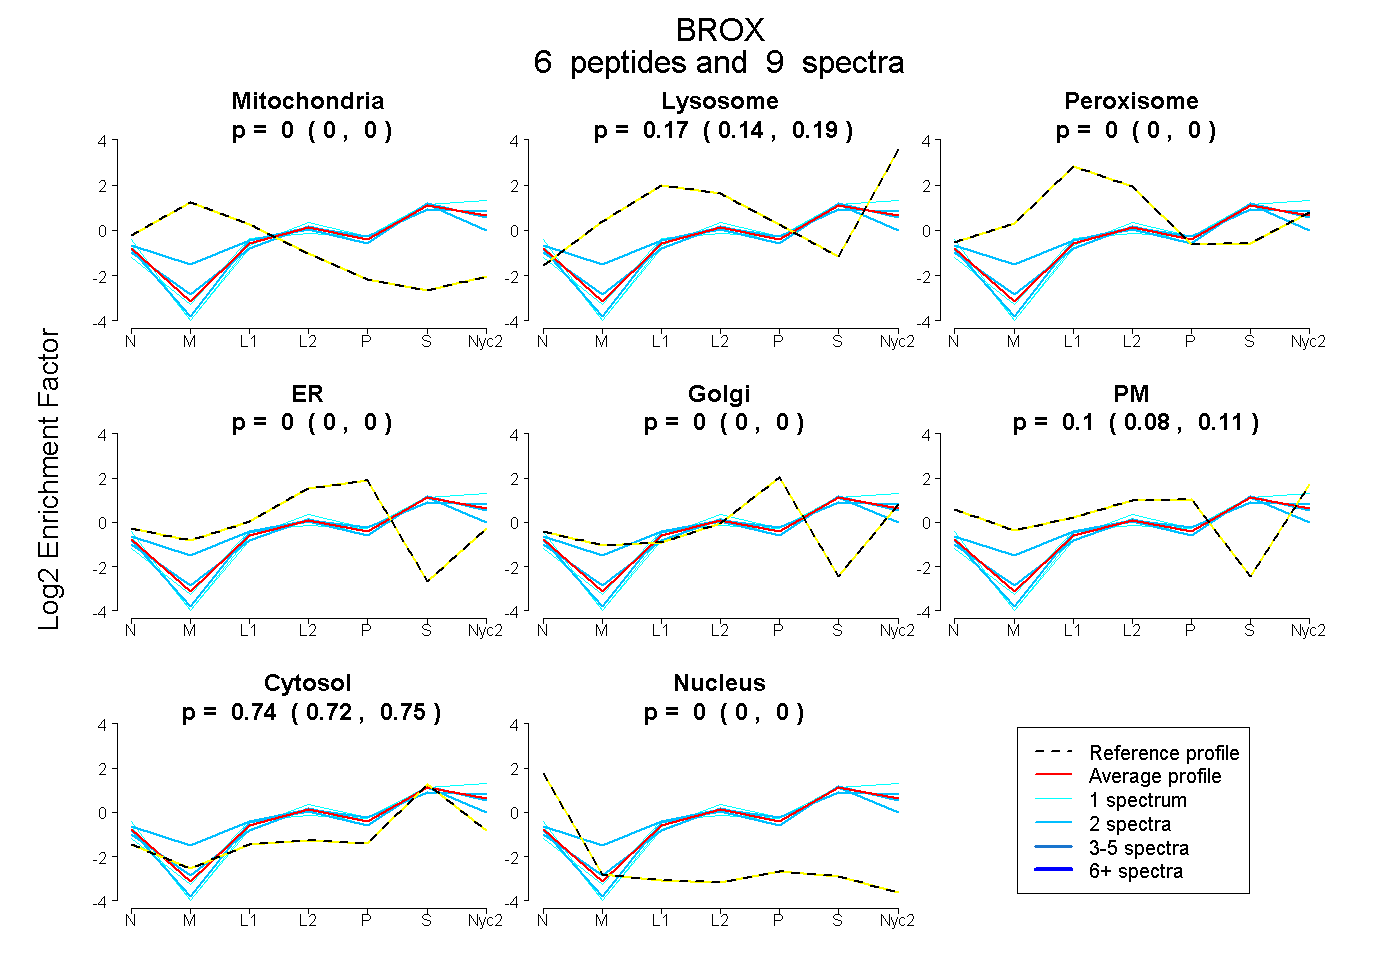
0.000 | 0.000
0.142 | 0.188
0.000 | 0.000
0.000 | 0.002
0.000 | 0.000
0.077 | 0.111
0.719 | 0.750
0.000 | 0.000
9peptides
spectra
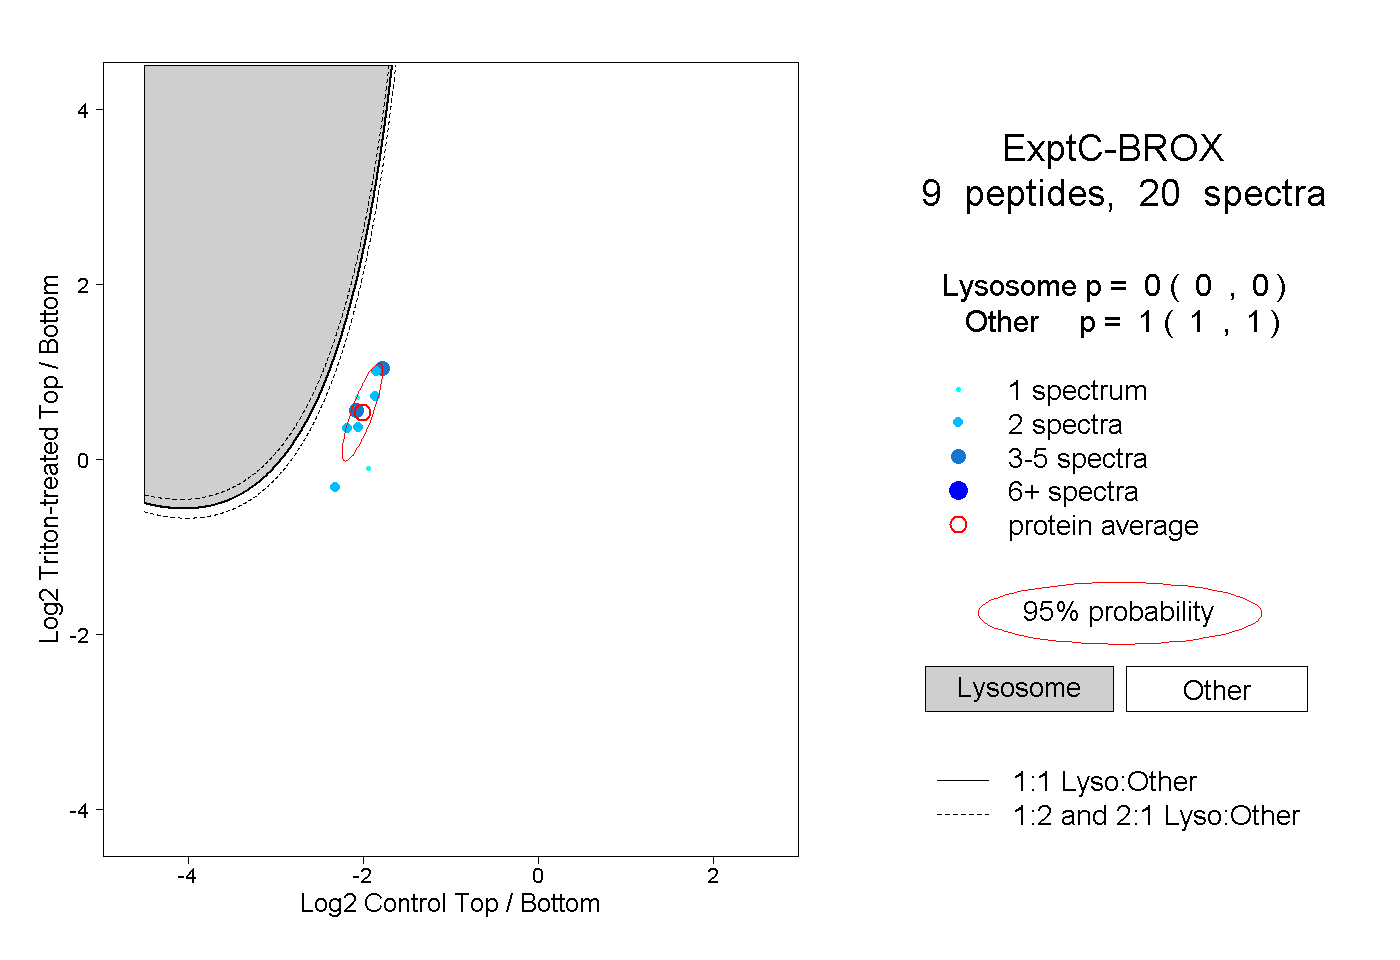
0.000 | 0.000
1.000 | 1.000
| Plot | Mito | Lyso | Perox | ER | Golgi | PM | Cytosol | Nucleus | |||||
| Expt A |
6 peptides |
9 spectra |
|
0.000 0.000 | 0.000 |
0.168 0.142 | 0.188 |
0.000 0.000 | 0.000 |
0.000 0.000 | 0.002 |
0.000 0.000 | 0.000 |
0.096 0.077 | 0.111 |
0.736 0.719 | 0.750 |
0.000 0.000 | 0.000 |
||
| Plot | Lyso | Other | |||||||||||
| Expt C |
9 peptides |
20 spectra |
|
0.000 0.000 | 0.000 |
1.000 1.000 | 1.000 |
| 2 spectra, ENGFIYFQK | 0.000 | 1.000 | ||||||||
| 3 spectra, ENITEDEAK | 0.000 | 1.000 | ||||||||
| 1 spectrum, ISVLGK | 0.000 | 1.000 | ||||||||
| 2 spectra, YIQNFK | 0.000 | 1.000 | ||||||||
| 5 spectra, EYGETK | 0.000 | 1.000 | ||||||||
| 2 spectra, LLTPAEK | 0.000 | 1.000 | ||||||||
| 2 spectra, SLQEAEK | 0.000 | 1.000 | ||||||||
| 1 spectrum, LYAEAEALCK | 0.000 | 1.000 | ||||||||
| 2 spectra, IAAGIFK | 0.000 | 1.000 |
| Plot | Lyso | Other | |||||||||||
| Expt D |
2 peptides |
2 spectra |
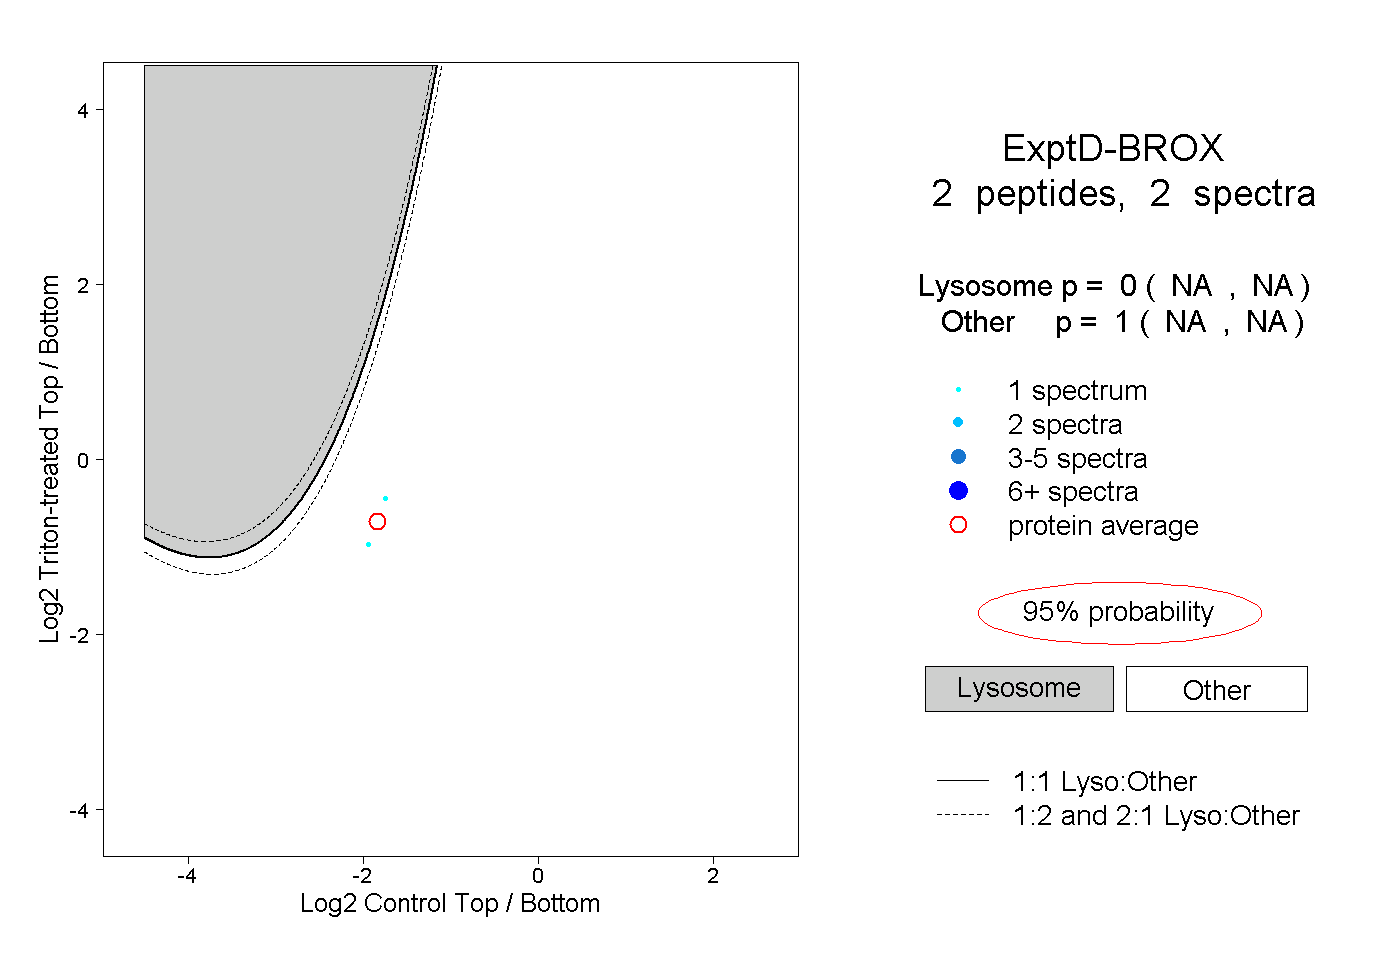 |
0.000 NA | NA |
1.000 NA | NA |