 8
8peptides
spectra
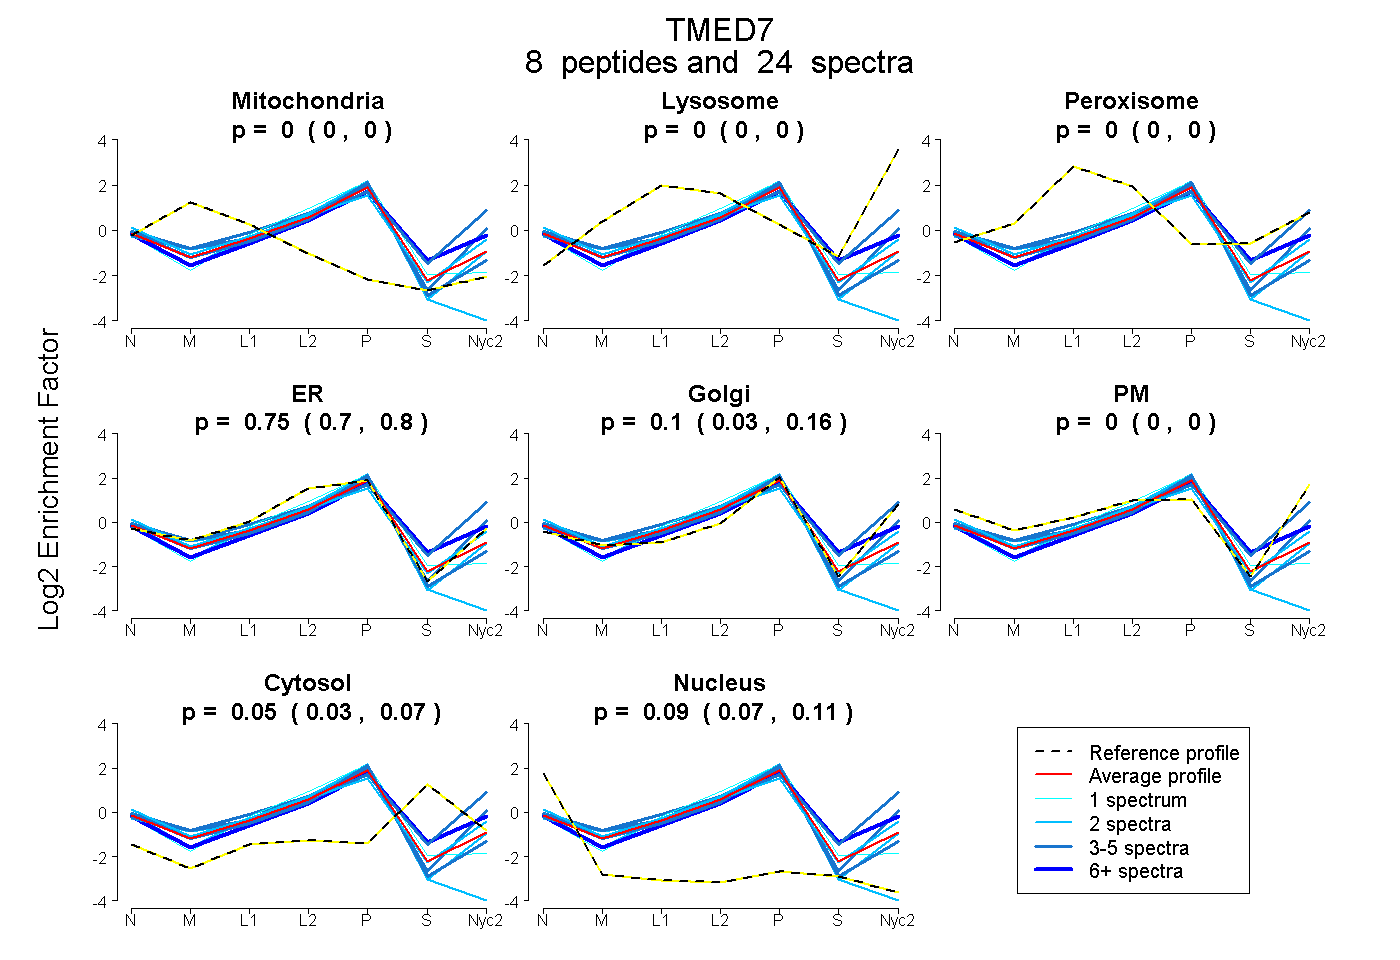
0.000 | 0.000
0.000 | 0.000
0.000 | 0.000
0.701 | 0.800
0.031 | 0.161
0.000 | 0.000
0.029 | 0.069
0.073 | 0.109
3peptides
spectra
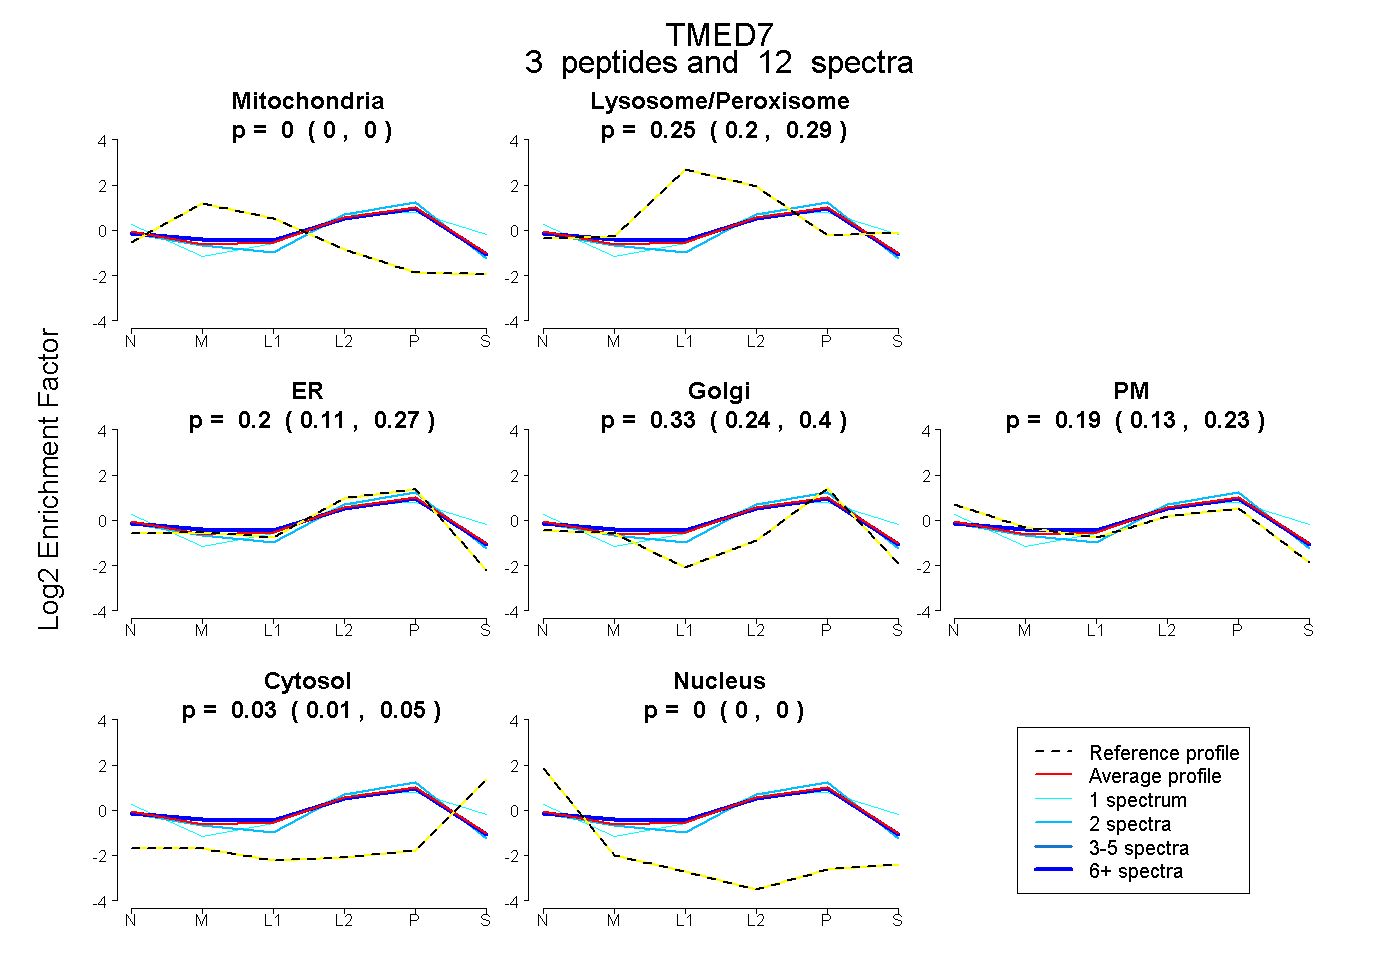
0.000 | 0.000
0.204 | 0.289
0.115 | 0.269
0.244 | 0.403
0.132 | 0.233
0.006 | 0.053
0.000 | 0.000
6peptides
spectra
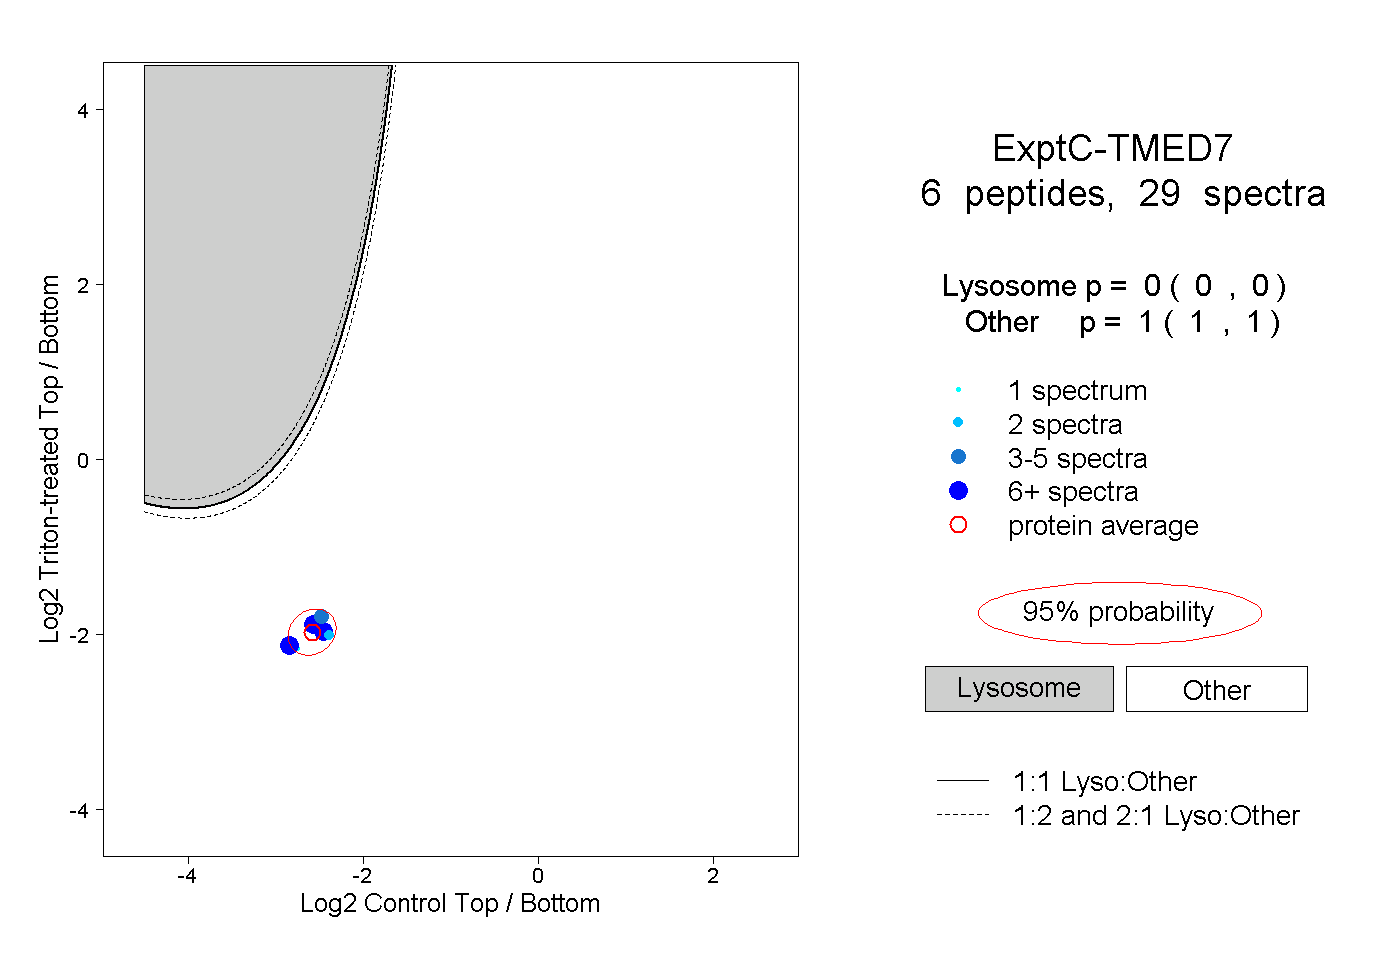
0.000 | 0.000
1.000 | 1.000
4peptides
spectra
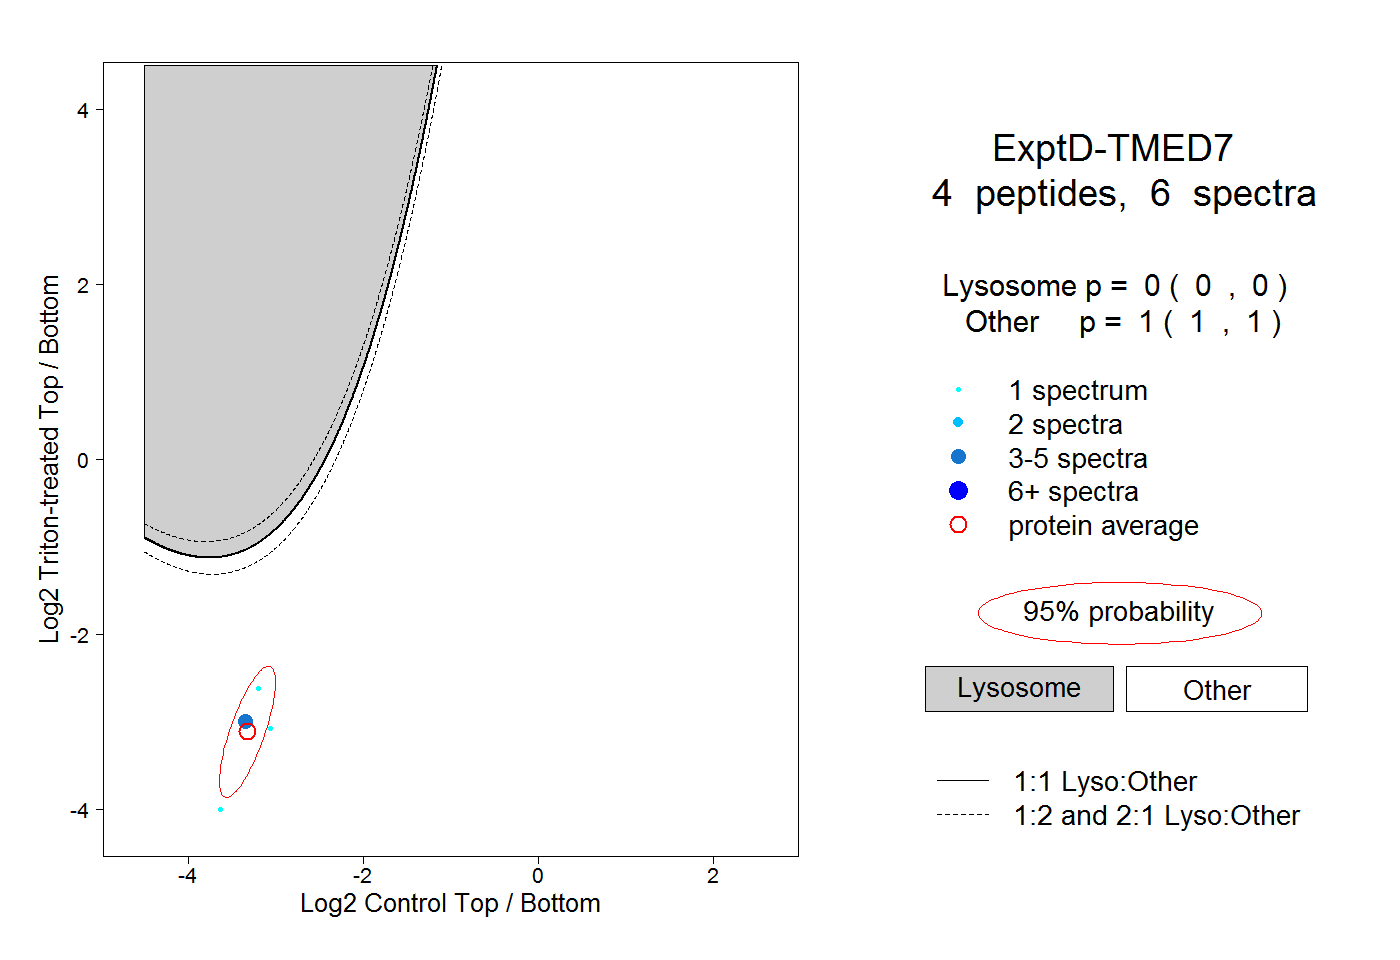
0.000 | 0.000
1.000 | 1.000