 8
8peptides
spectra
0.000 | 0.000
0.000 | 0.000
0.000 | 0.000
0.701 | 0.800
0.031 | 0.161
0.000 | 0.000
0.029 | 0.069
0.073 | 0.109
| Plot | Mito | Lyso | Perox | ER | Golgi | PM | Cytosol | Nucleus | |||||
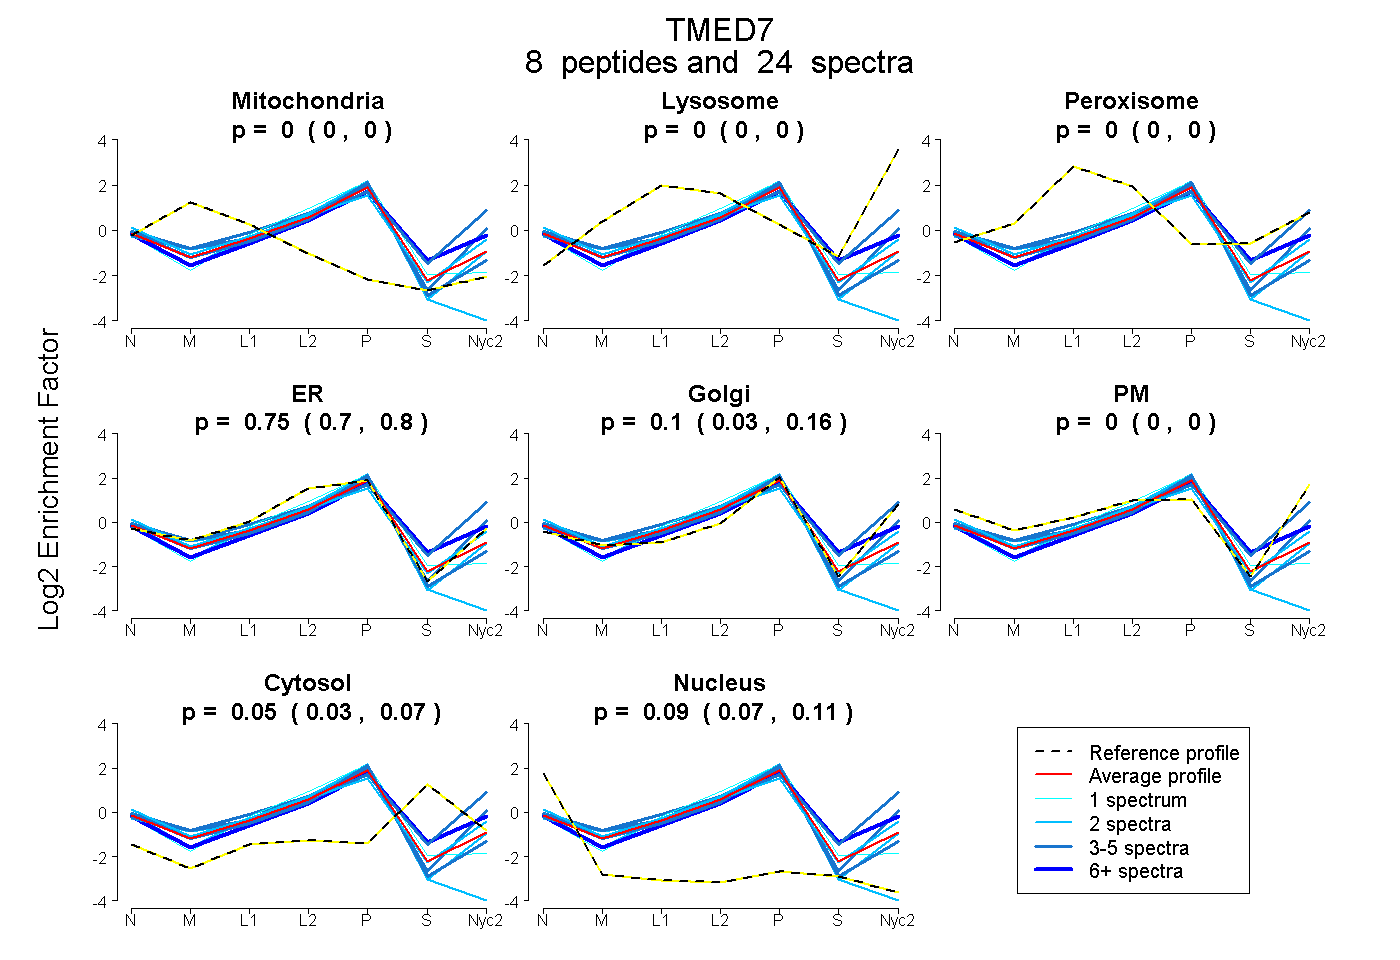
| Expt A |
8 peptides |
24 spectra |
|
0.000 0.000 | 0.000 |
0.000 0.000 | 0.000 |
0.000 0.000 | 0.000 |
0.755 0.701 | 0.800 |
0.102 0.031 | 0.161 |
0.000 0.000 | 0.000 |
0.051 0.029 | 0.069 |
0.092 0.073 | 0.109 |
| 3 spectra, QYDSFTFTASK | 0.000 | 0.000 | 0.000 | 0.805 | 0.052 | 0.000 | 0.000 | 0.142 | ||
| 2 spectra, QCFYEDITQGTK | 0.000 | 0.000 | 0.000 | 0.758 | 0.148 | 0.000 | 0.000 | 0.094 | ||
| 1 spectrum, FCFSNEFSTFTHK | 0.000 | 0.000 | 0.000 | 0.828 | 0.000 | 0.000 | 0.074 | 0.097 | ||
| 3 spectra, SFFSDK | 0.000 | 0.066 | 0.055 | 0.120 | 0.549 | 0.127 | 0.082 | 0.000 | ||
| 2 spectra, CTLEFQVITGGHYDVDCR | 0.000 | 0.000 | 0.000 | 0.745 | 0.000 | 0.000 | 0.000 | 0.255 | ||
| 2 spectra, SVIDYQTHFR | 0.000 | 0.000 | 0.019 | 0.648 | 0.174 | 0.036 | 0.027 | 0.095 | ||
| 4 spectra, AEDLNTR | 0.011 | 0.000 | 0.000 | 0.582 | 0.308 | 0.083 | 0.000 | 0.016 | ||
| 7 spectra, LEDPDGK | 0.000 | 0.000 | 0.000 | 0.454 | 0.328 | 0.000 | 0.219 | 0.000 |
| Plot | Mito | Lyso or Perox | ER | Golgi | PM | Cytosol | Nucleus | ||||||
| Expt B |
3 peptides |
12 spectra |
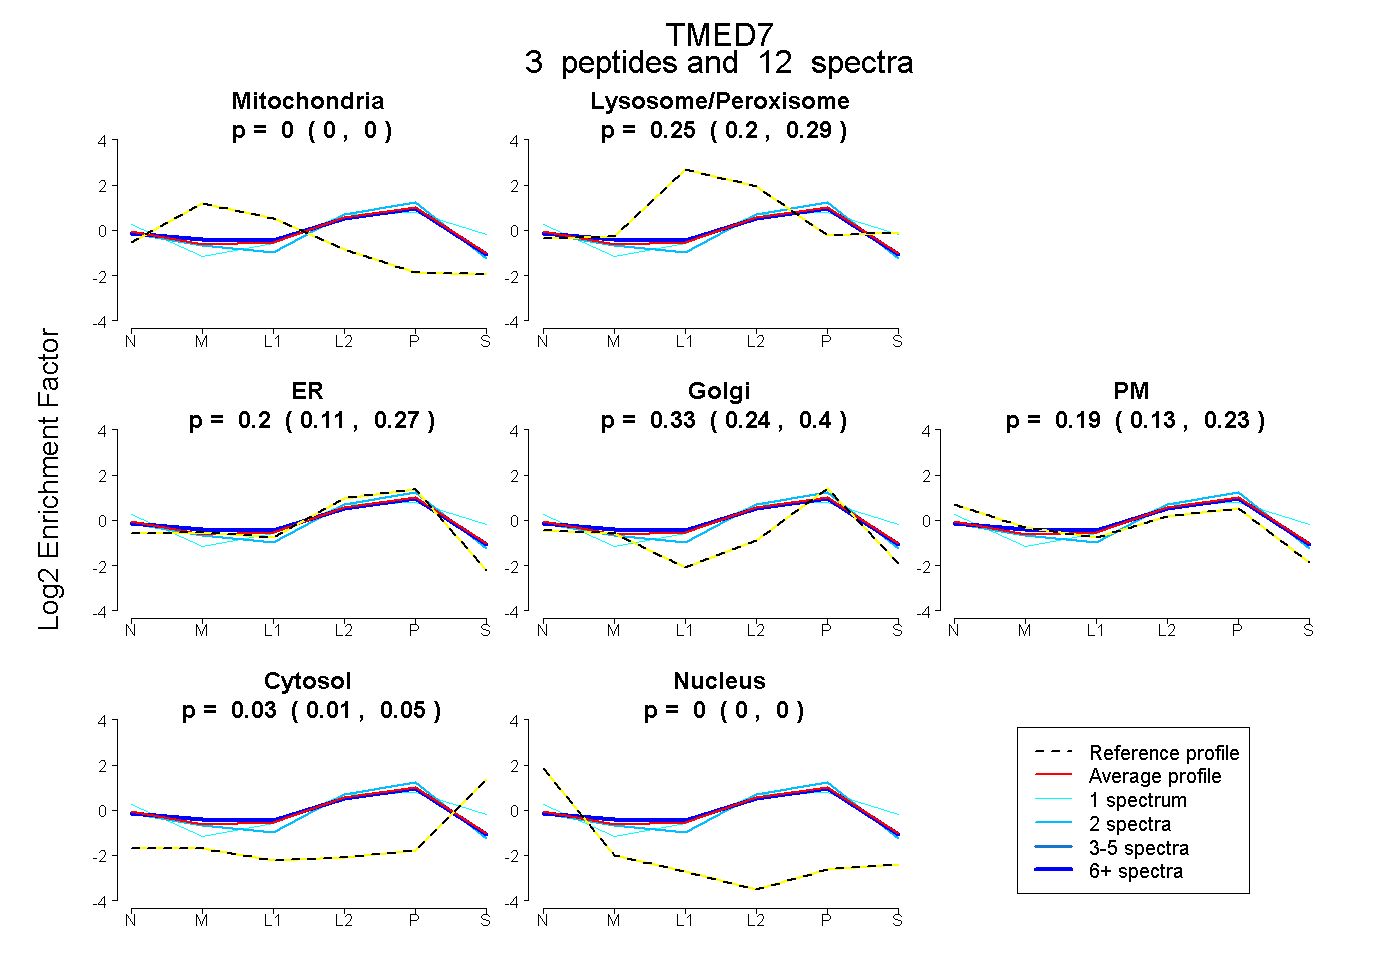 |
0.000 0.000 | 0.000 |
0.251 0.204 | 0.289 |
0.198 0.115 | 0.269 |
0.330 0.244 | 0.403 |
0.189 0.132 | 0.233 |
0.032 0.006 | 0.053 |
0.000 0.000 | 0.000 |
|||
| Plot | Lyso | Other | |||||||||||
| Expt C |
6 peptides |
29 spectra |
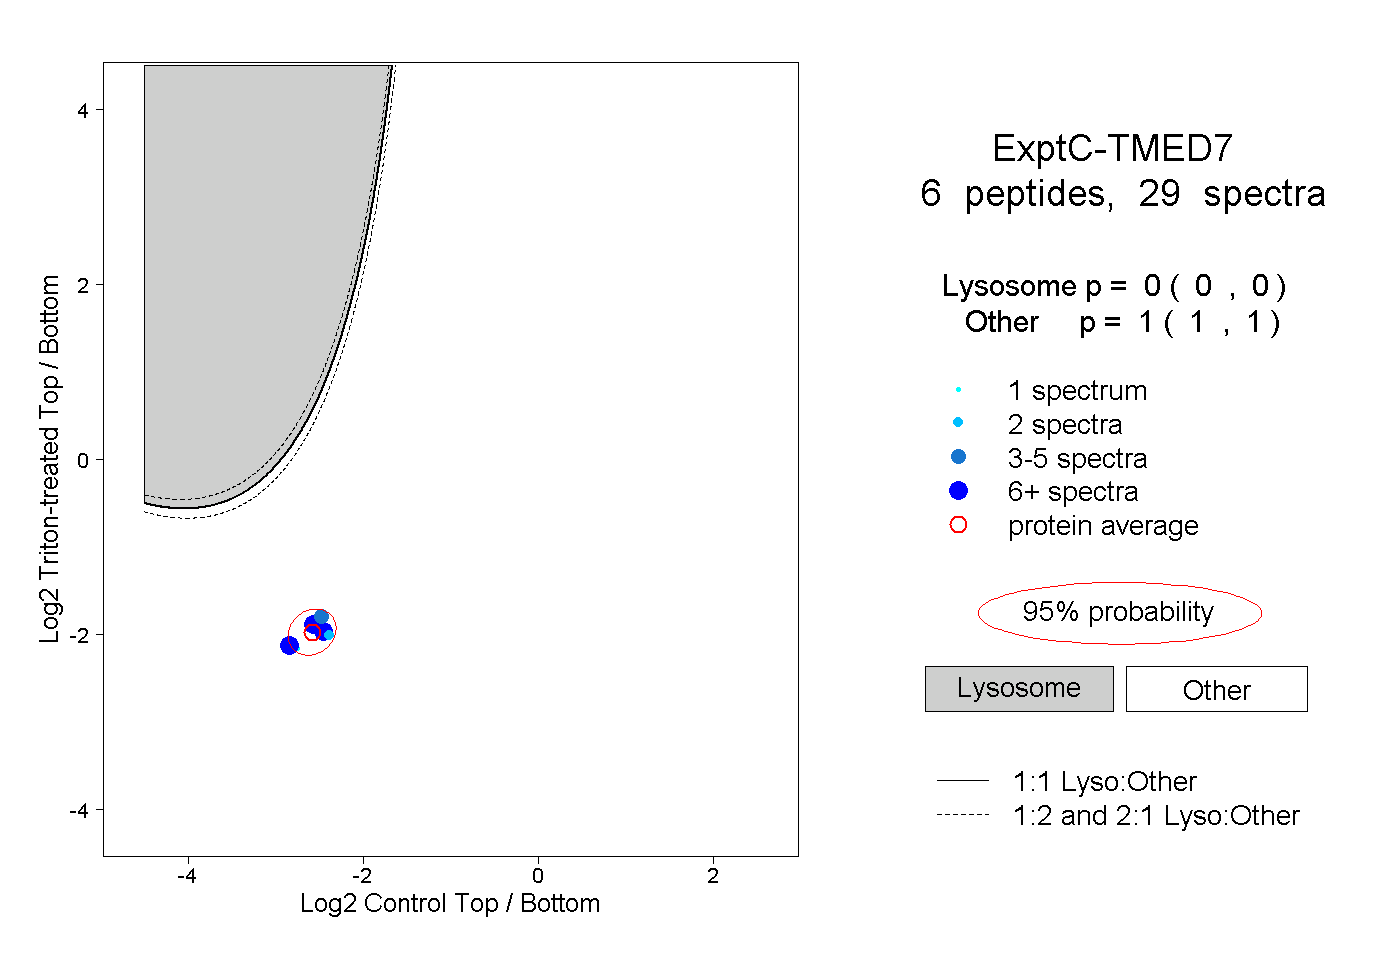 |
0.000 0.000 | 0.000 |
1.000 1.000 | 1.000 |
||||||||
| Plot | Lyso | Other | |||||||||||
| Expt D |
4 peptides |
6 spectra |
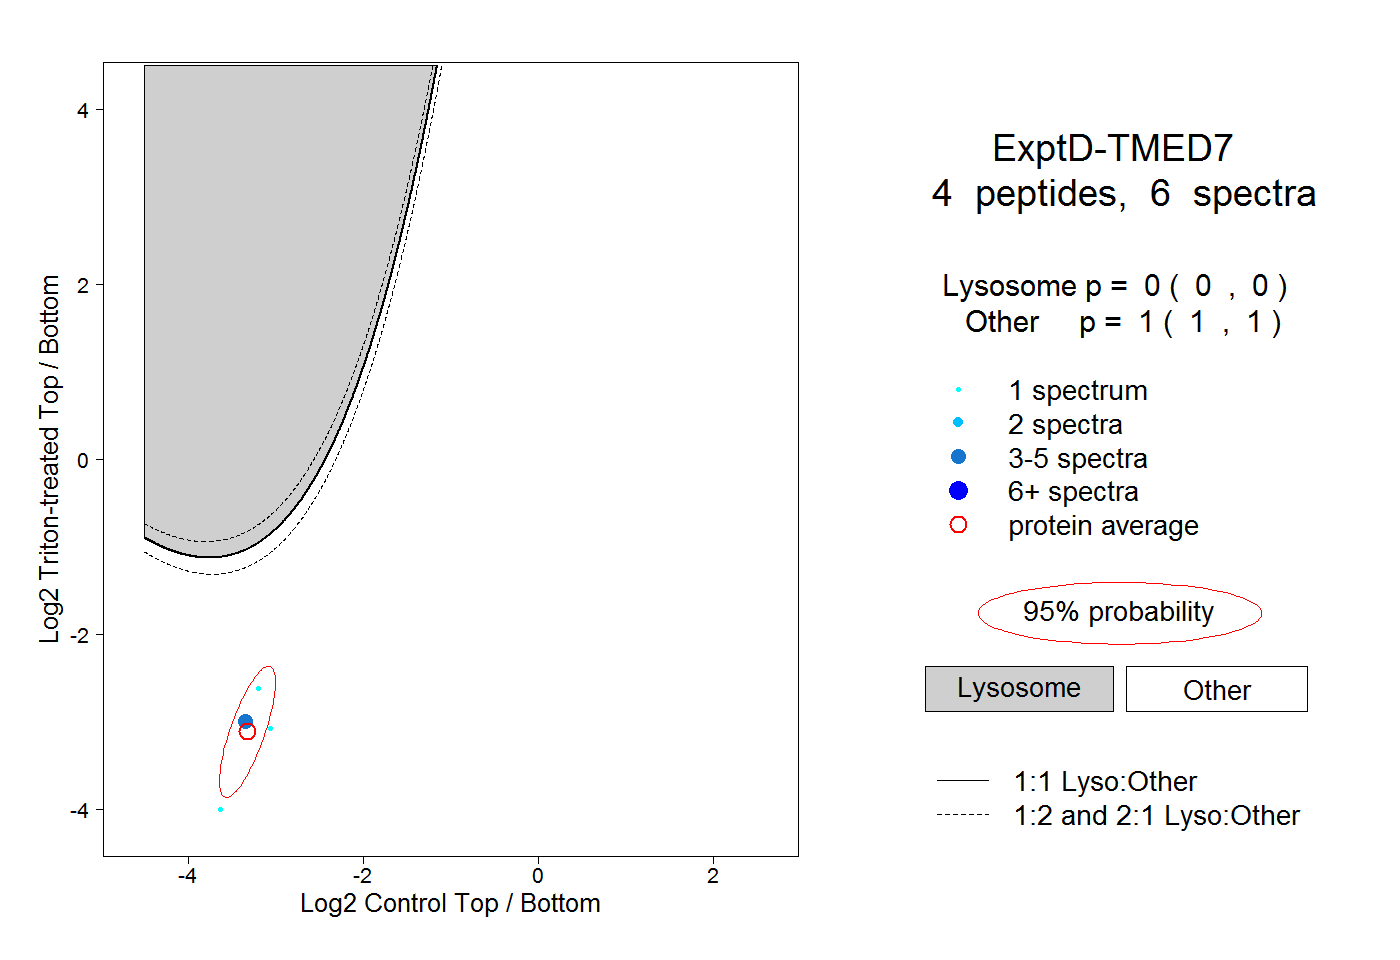 |
0.000 0.000 | 0.000 |
1.000 1.000 | 1.000 |