 21
21peptides
spectra
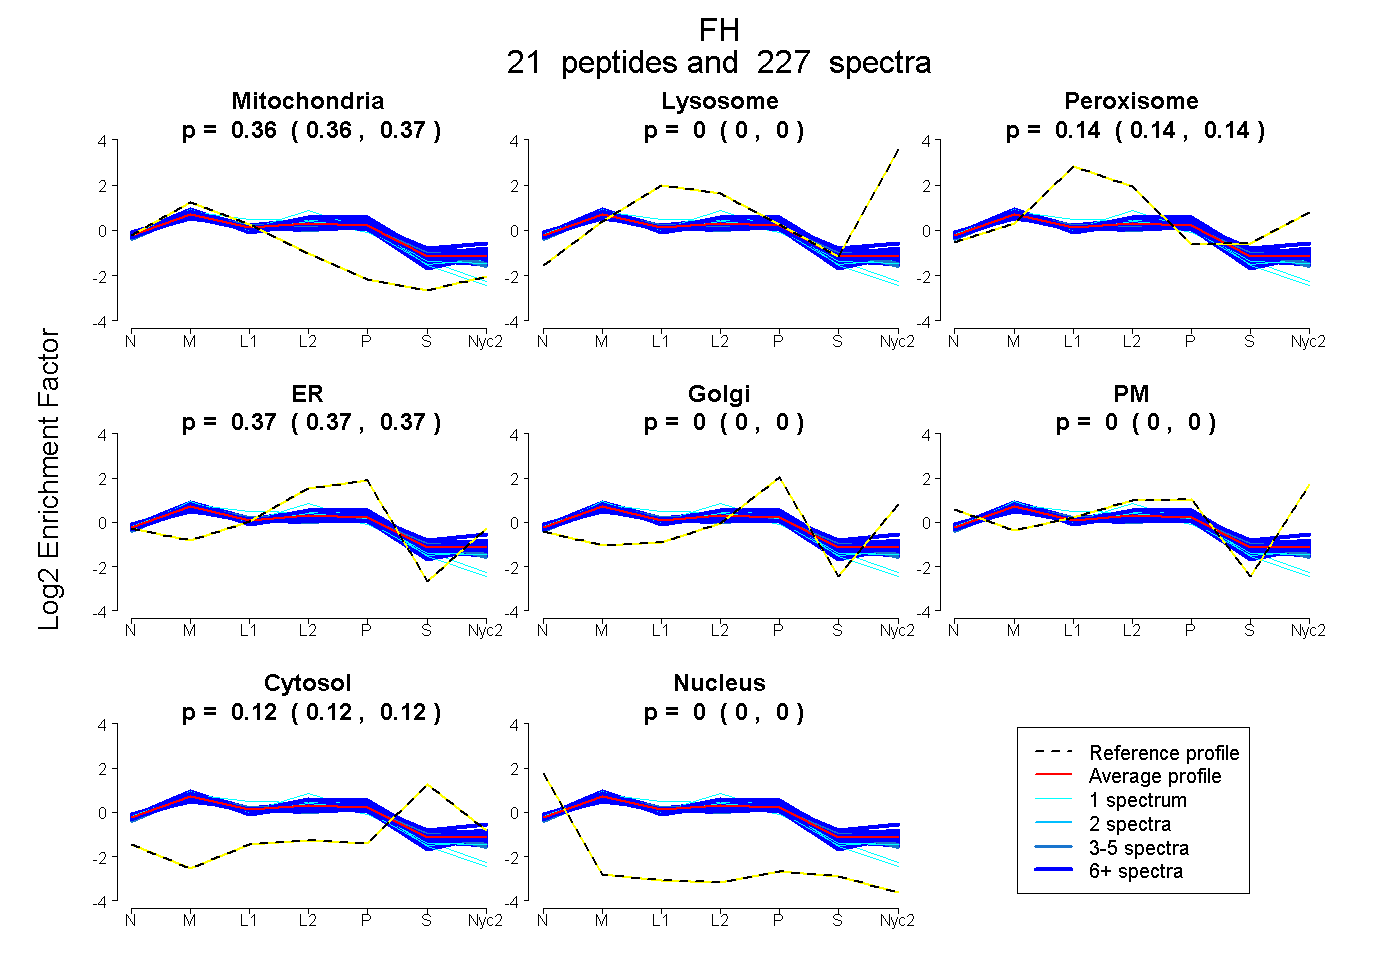
0.363 | 0.365
0.000 | 0.000
0.142 | 0.145
0.371 | 0.374
0.000 | 0.000
0.000 | 0.000
0.119 | 0.121
0.000 | 0.000
20peptides
spectra
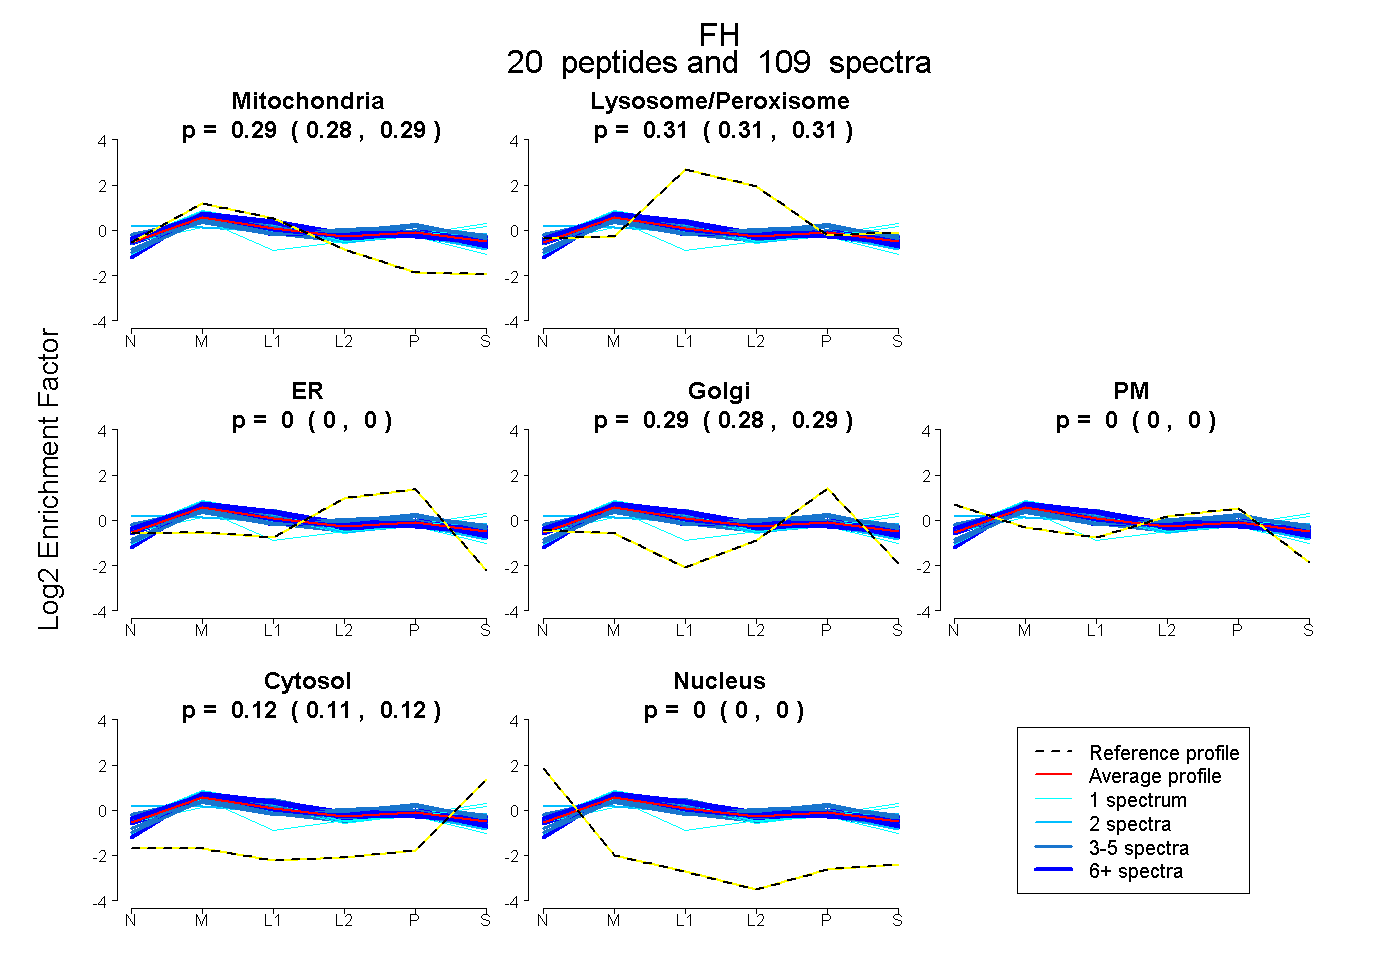
0.284 | 0.289
0.308 | 0.311
0.000 | 0.000
0.285 | 0.289
0.000 | 0.000
0.114 | 0.118
0.000 | 0.000
22peptides
spectra
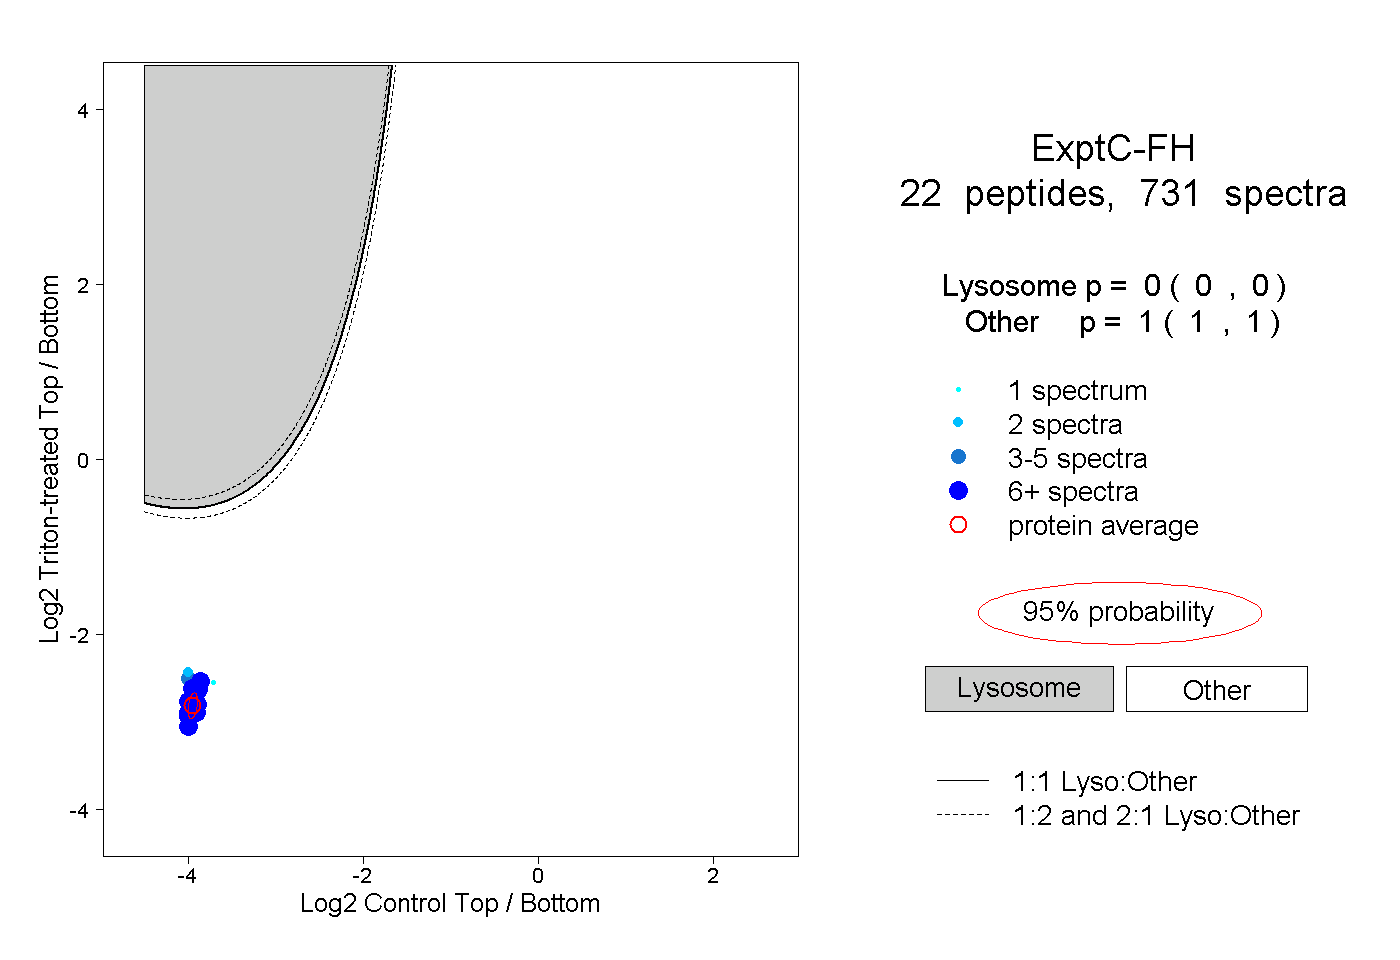
0.000 | 0.000
1.000 | 1.000
17peptides
spectra
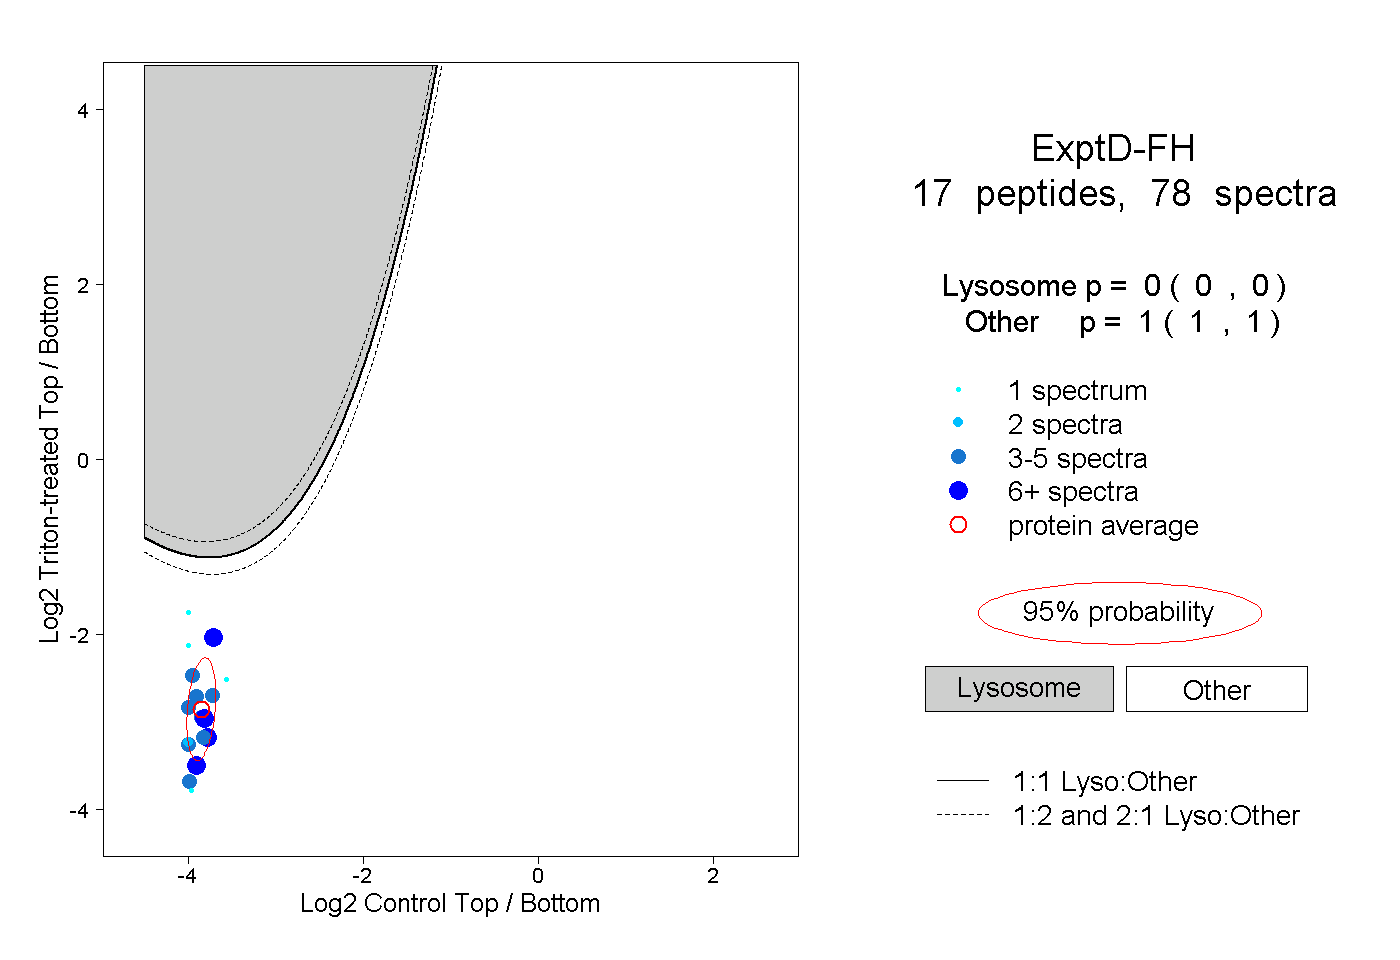
0.000 | 0.000
1.000 | 1.000