 21
21peptides
spectra
0.363 | 0.365
0.000 | 0.000
0.142 | 0.145
0.371 | 0.374
0.000 | 0.000
0.000 | 0.000
0.119 | 0.121
0.000 | 0.000
| Plot | Mito | Lyso | Perox | ER | Golgi | PM | Cytosol | Nucleus | |||||
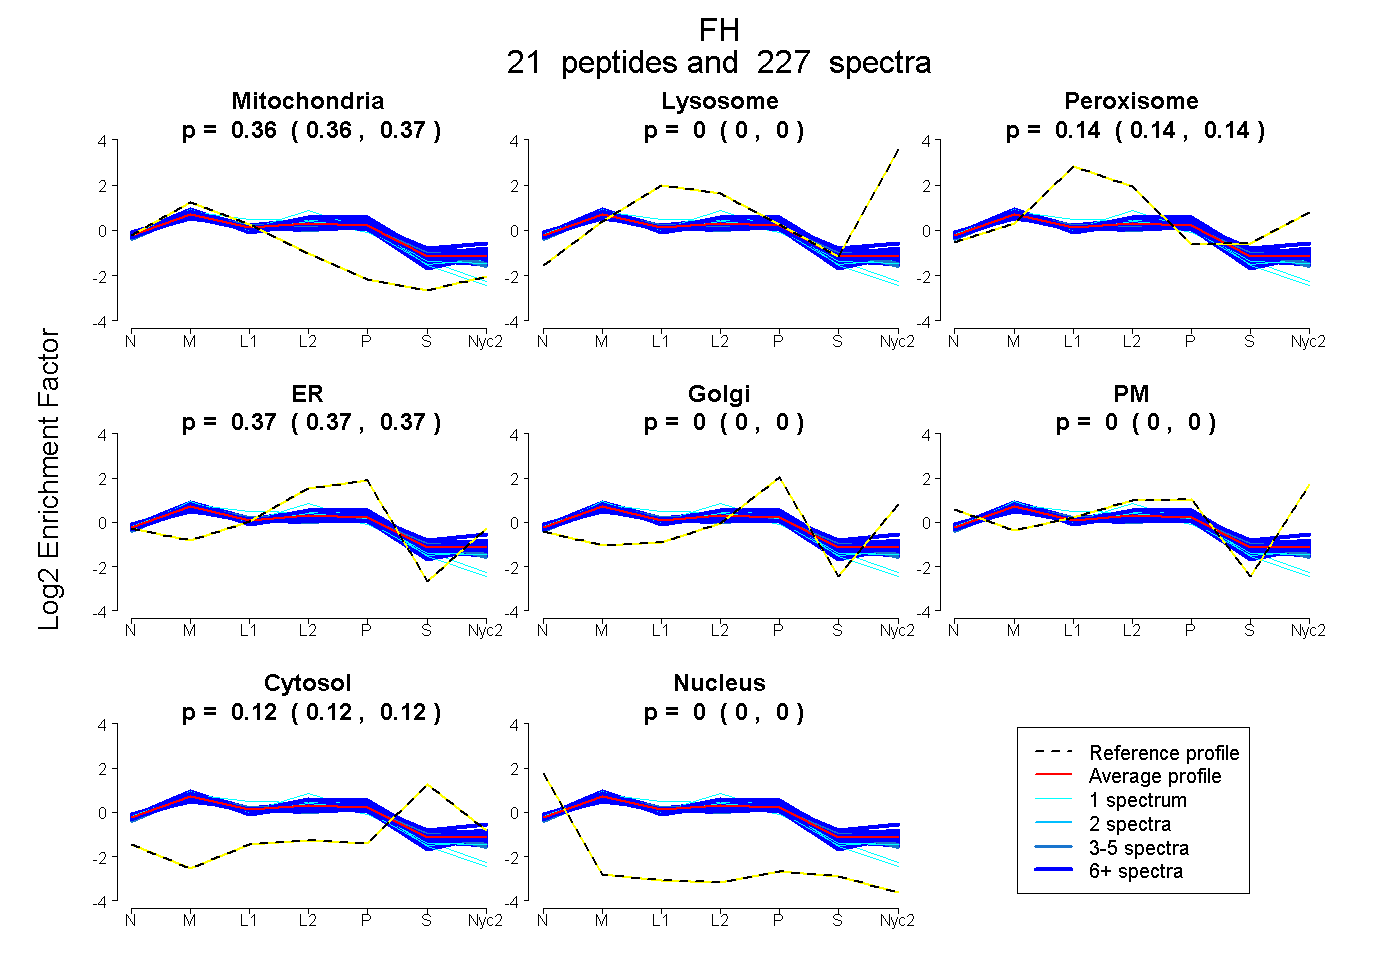
| Expt A |
21 peptides |
227 spectra |
|
0.364 0.363 | 0.365 |
0.000 0.000 | 0.000 |
0.143 0.142 | 0.145 |
0.373 0.371 | 0.374 |
0.000 0.000 | 0.000 |
0.000 0.000 | 0.000 |
0.120 0.119 | 0.121 |
0.000 0.000 | 0.000 |
| 10 spectra, IGGATER | 0.444 | 0.000 | 0.070 | 0.397 | 0.000 | 0.000 | 0.089 | 0.000 | ||
| 35 spectra, YYGAQTVR | 0.421 | 0.000 | 0.119 | 0.315 | 0.025 | 0.000 | 0.120 | 0.000 | ||
| 14 spectra, IANDIR | 0.410 | 0.000 | 0.112 | 0.349 | 0.027 | 0.000 | 0.101 | 0.000 | ||
| 1 spectrum, KPVHPNDHVNK | 0.513 | 0.000 | 0.052 | 0.416 | 0.000 | 0.000 | 0.019 | 0.000 | ||
| 5 spectra, MPIPVIK | 0.391 | 0.000 | 0.139 | 0.312 | 0.000 | 0.000 | 0.158 | 0.000 | ||
| 1 spectrum, IYELAAGGTAVGTGLNTR | 0.409 | 0.000 | 0.144 | 0.407 | 0.000 | 0.000 | 0.040 | 0.000 | ||
| 14 spectra, IGFAEK | 0.321 | 0.000 | 0.184 | 0.295 | 0.030 | 0.000 | 0.170 | 0.000 | ||
| 13 spectra, IASAIMK | 0.412 | 0.000 | 0.135 | 0.410 | 0.000 | 0.000 | 0.043 | 0.000 | ||
| 11 spectra, STMNFK | 0.358 | 0.000 | 0.182 | 0.295 | 0.041 | 0.000 | 0.123 | 0.000 | ||
| 30 spectra, FLGSGPR | 0.447 | 0.000 | 0.105 | 0.400 | 0.013 | 0.000 | 0.036 | 0.000 | ||
| 1 spectrum, VAALTGLPFVTAPNK | 0.430 | 0.000 | 0.083 | 0.405 | 0.000 | 0.000 | 0.082 | 0.000 | ||
| 6 spectra, DMLGPK | 0.317 | 0.000 | 0.183 | 0.179 | 0.214 | 0.000 | 0.107 | 0.000 | ||
| 10 spectra, IEYDTFGELK | 0.437 | 0.000 | 0.100 | 0.374 | 0.000 | 0.000 | 0.089 | 0.000 | ||
| 5 spectra, AAAEVNQEYGLDPK | 0.360 | 0.000 | 0.154 | 0.378 | 0.000 | 0.000 | 0.107 | 0.000 | ||
| 1 spectrum, EFAQVIK | 0.521 | 0.000 | 0.029 | 0.365 | 0.000 | 0.000 | 0.085 | 0.000 | ||
| 14 spectra, AFGLLK | 0.256 | 0.000 | 0.261 | 0.141 | 0.208 | 0.000 | 0.134 | 0.000 | ||
| 7 spectra, LHDALSAK | 0.276 | 0.000 | 0.146 | 0.445 | 0.000 | 0.000 | 0.132 | 0.000 | ||
| 23 spectra, NVLHSAR | 0.285 | 0.000 | 0.178 | 0.351 | 0.017 | 0.000 | 0.168 | 0.000 | ||
| 5 spectra, LMNESLMLVTALNPHIGYDK | 0.415 | 0.000 | 0.125 | 0.306 | 0.000 | 0.000 | 0.154 | 0.000 | ||
| 10 spectra, AIEMLGGELGSK | 0.315 | 0.000 | 0.195 | 0.272 | 0.098 | 0.000 | 0.121 | 0.000 | ||
| 11 spectra, AADEVAEGK | 0.281 | 0.000 | 0.180 | 0.396 | 0.000 | 0.000 | 0.142 | 0.000 |
| Plot | Mito | Lyso or Perox | ER | Golgi | PM | Cytosol | Nucleus | ||||||
| Expt B |
20 peptides |
109 spectra |
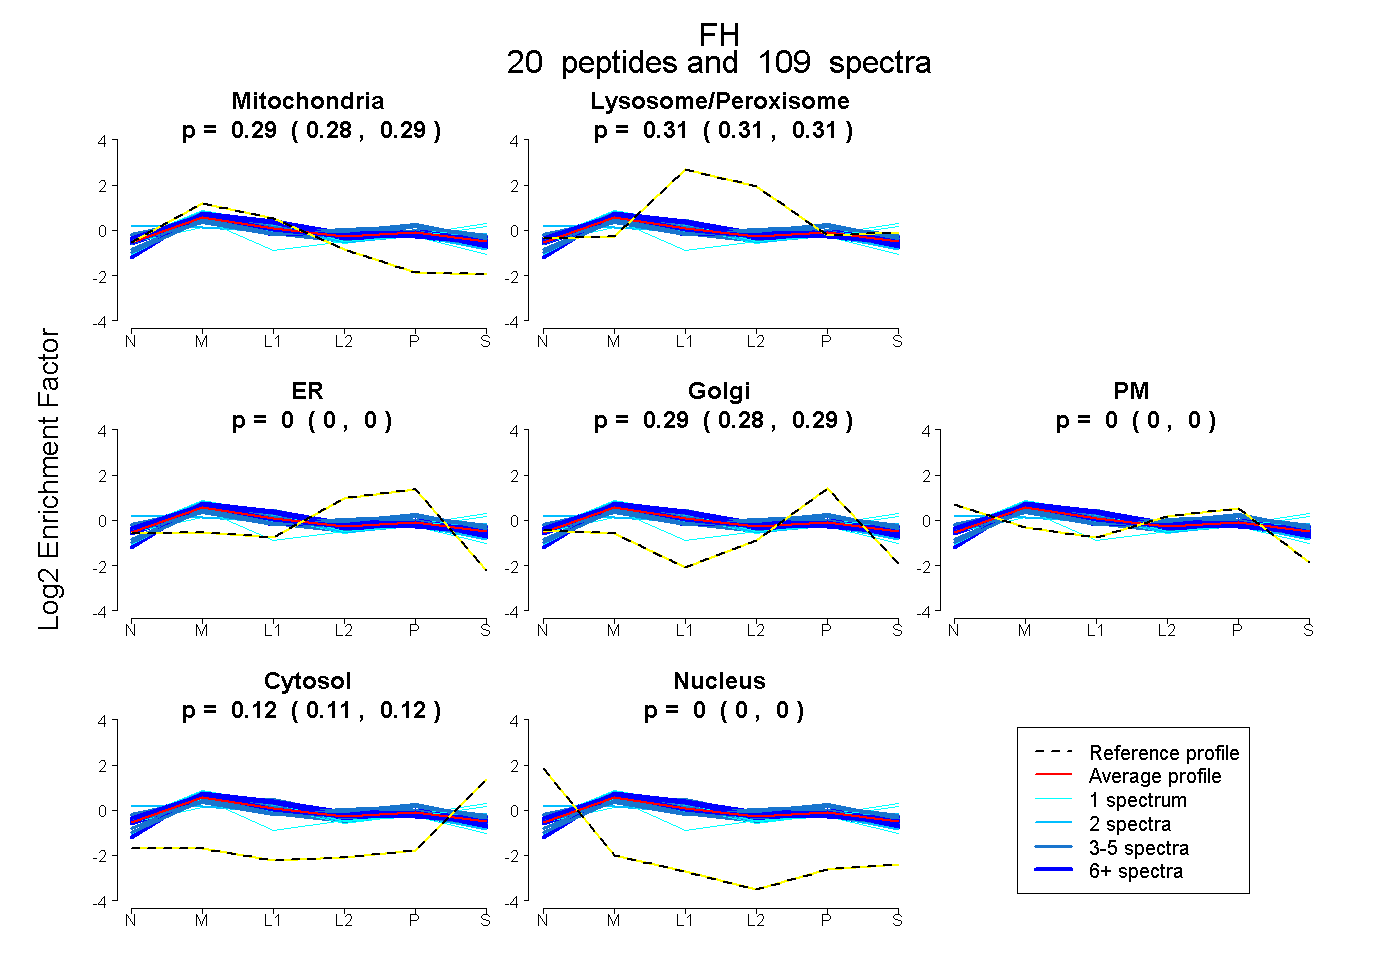 |
0.287 0.284 | 0.289 |
0.310 0.308 | 0.311 |
0.000 0.000 | 0.000 |
0.287 0.285 | 0.289 |
0.000 0.000 | 0.000 |
0.116 0.114 | 0.118 |
0.000 0.000 | 0.000 |
|||
| Plot | Lyso | Other | |||||||||||
| Expt C |
22 peptides |
731 spectra |
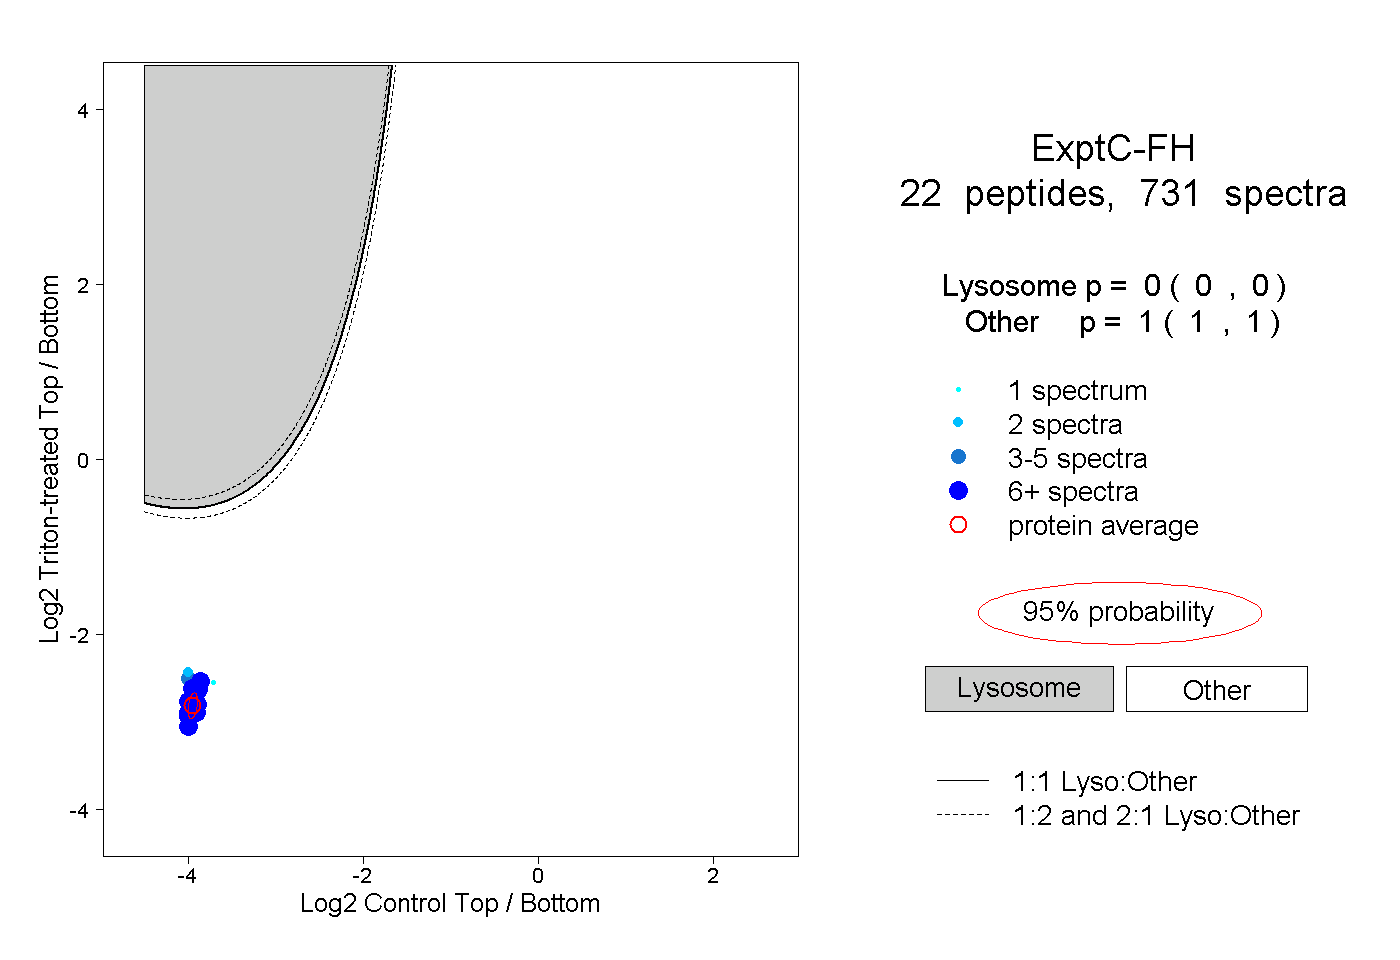 |
0.000 0.000 | 0.000 |
1.000 1.000 | 1.000 |
||||||||
| Plot | Lyso | Other | |||||||||||
| Expt D |
17 peptides |
78 spectra |
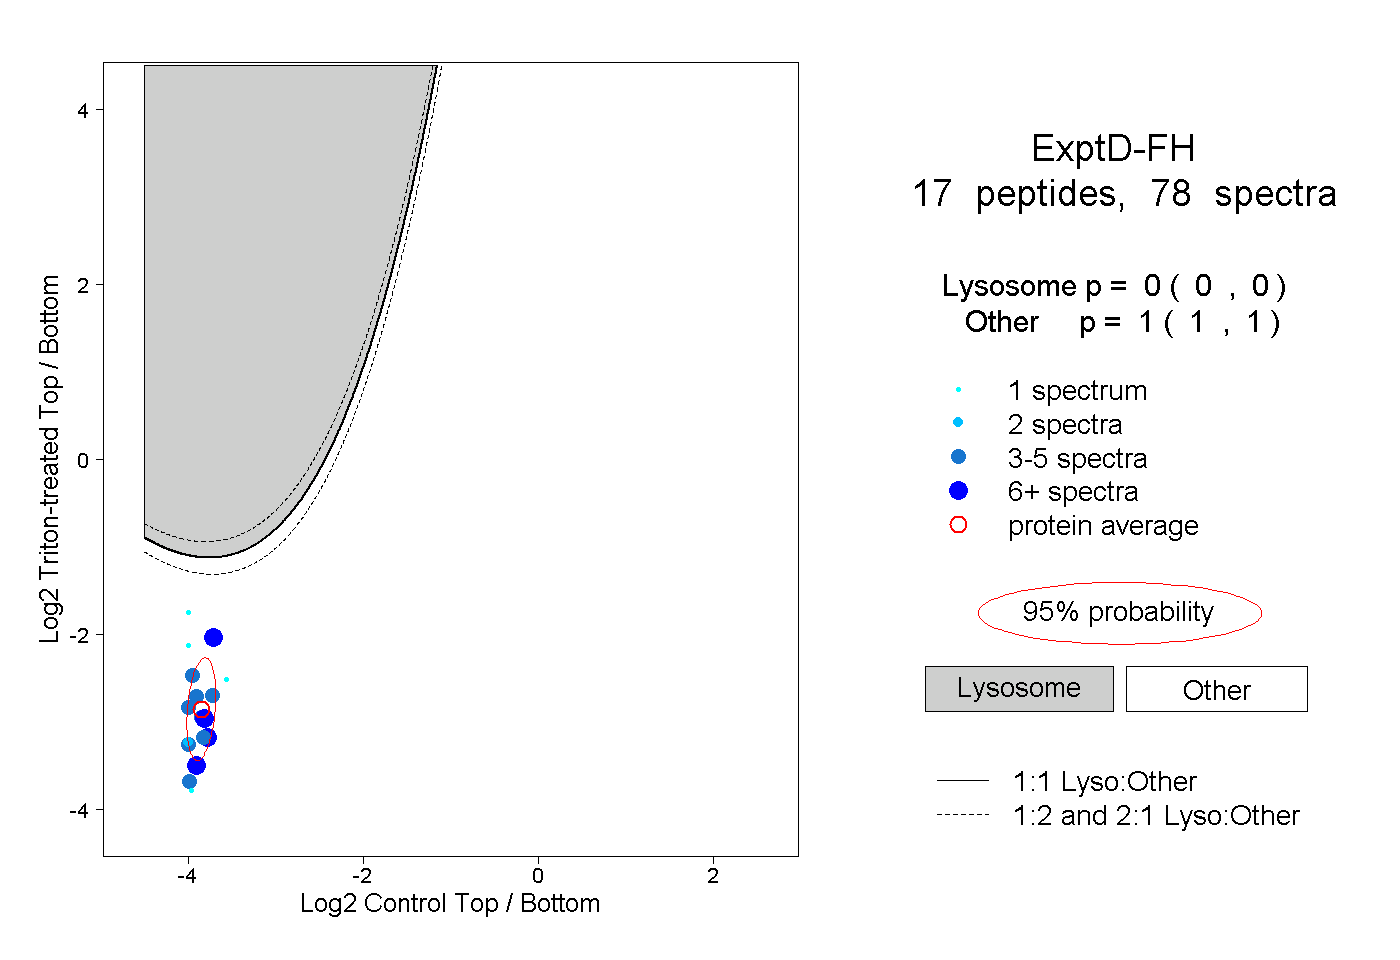 |
0.000 0.000 | 0.000 |
1.000 1.000 | 1.000 |