 8
8peptides
spectra
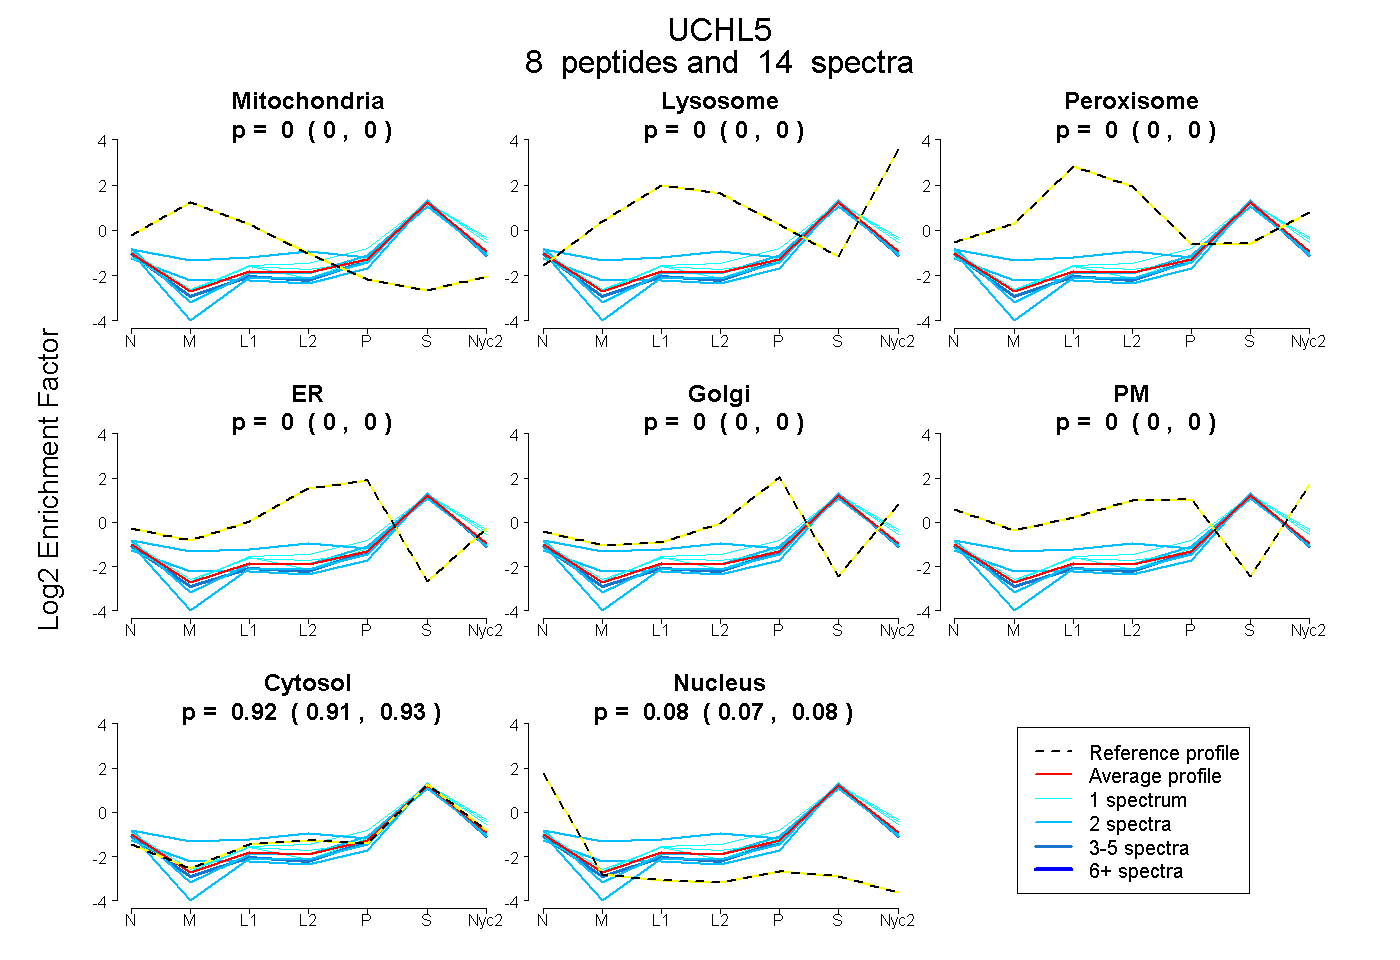
0.000 | 0.000
0.000 | 0.000
0.000 | 0.000
0.000 | 0.000
0.000 | 0.000
0.000 | 0.000
0.914 | 0.927
0.072 | 0.085
3peptides
spectra
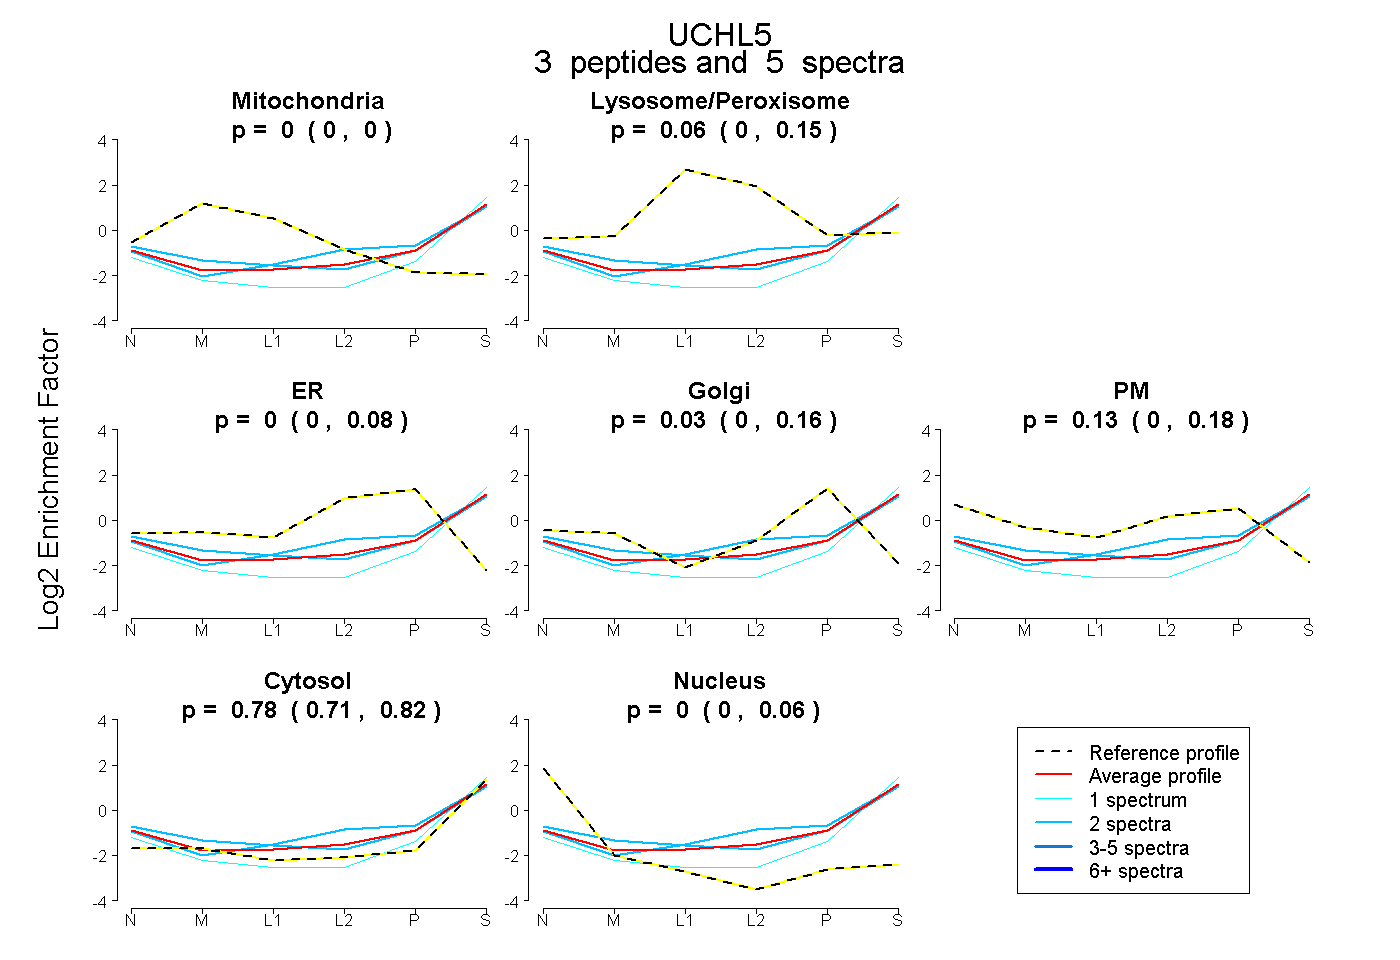
0.000 | 0.000
0.000 | 0.149
0.000 | 0.080
0.000 | 0.159
0.000 | 0.184
0.706 | 0.818
0.000 | 0.057
3peptides
spectra
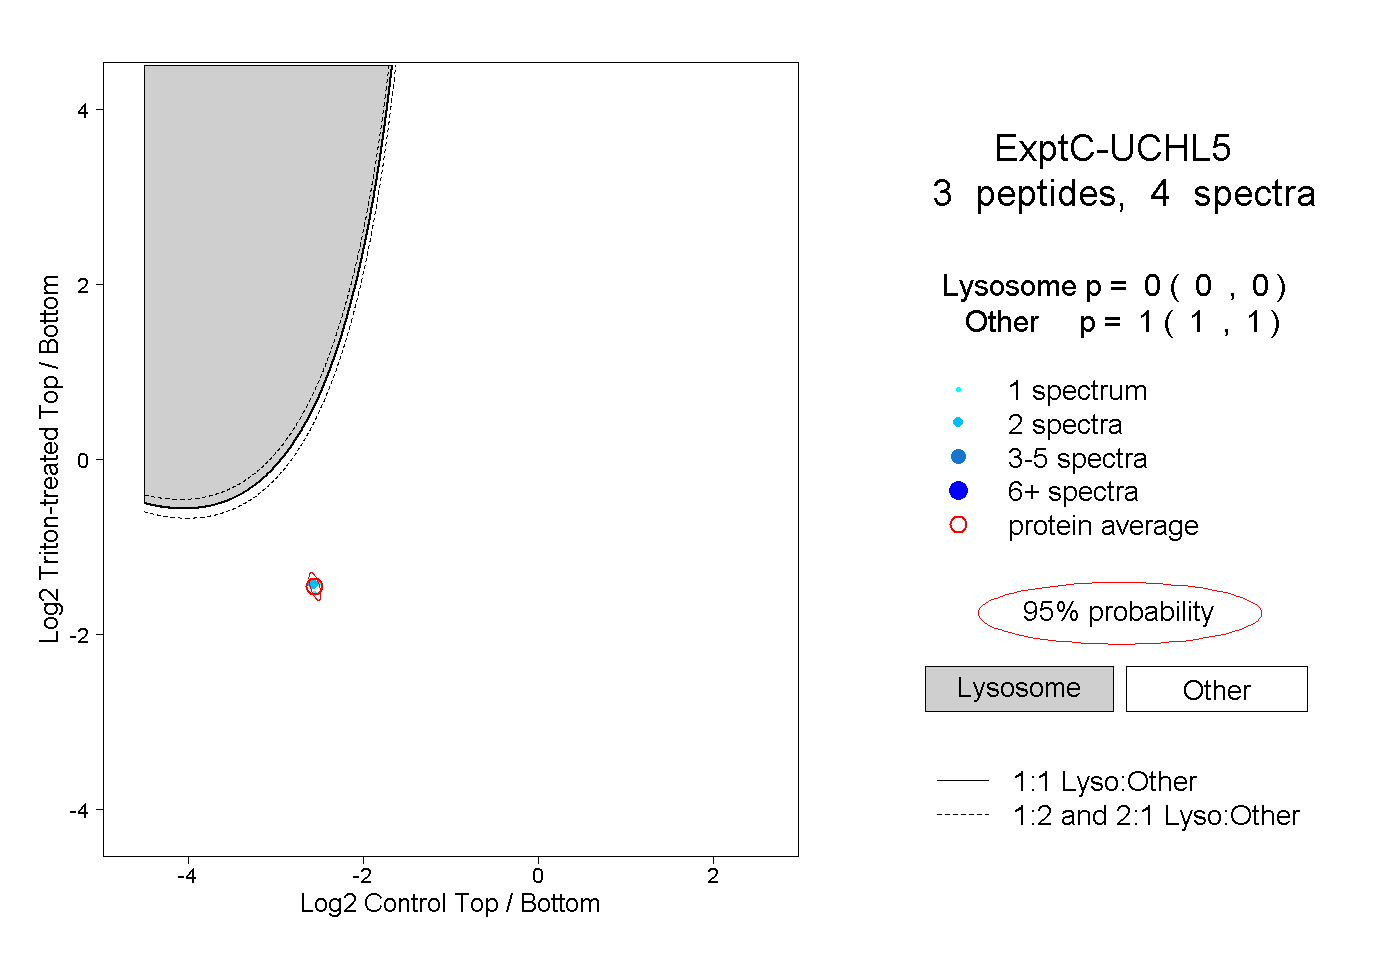
0.000 | 0.000
1.000 | 1.000