 8
8peptides
spectra
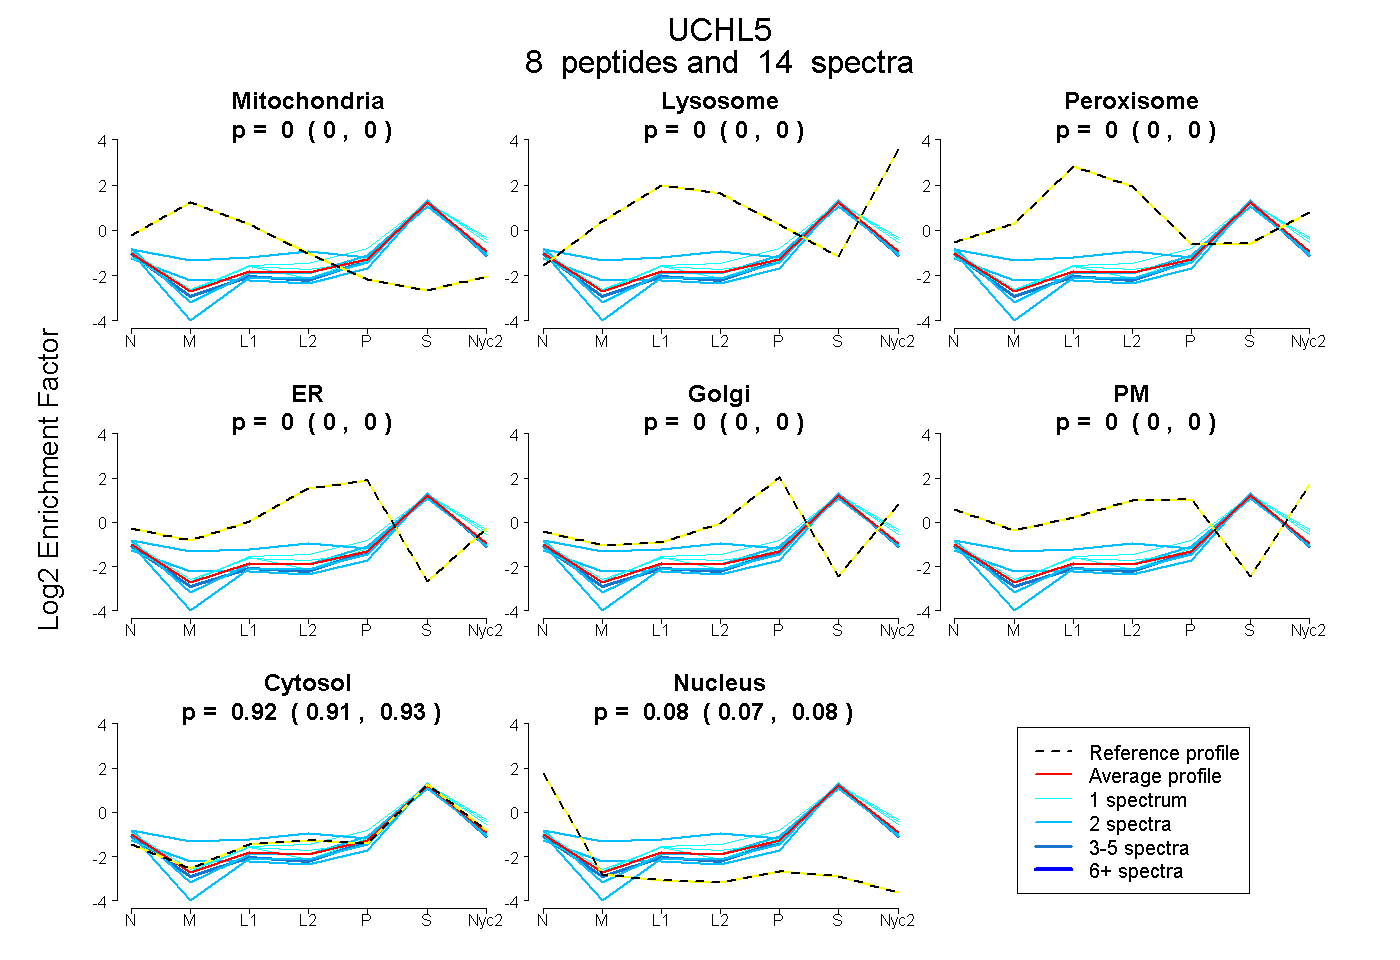
0.000 | 0.000
0.000 | 0.000
0.000 | 0.000
0.000 | 0.000
0.000 | 0.000
0.000 | 0.000
0.914 | 0.927
0.072 | 0.085
| Plot | Mito | Lyso | Perox | ER | Golgi | PM | Cytosol | Nucleus | |||||
| Expt A |
8 peptides |
14 spectra |
|
0.000 0.000 | 0.000 |
0.000 0.000 | 0.000 |
0.000 0.000 | 0.000 |
0.000 0.000 | 0.000 |
0.000 0.000 | 0.000 |
0.000 0.000 | 0.000 |
0.921 0.914 | 0.927 |
0.079 0.072 | 0.085 |
| 1 spectrum, LYELDGLR | 0.000 | 0.000 | 0.000 | 0.000 | 0.000 | 0.000 | 0.964 | 0.036 | ||
| 1 spectrum, GAQVEEIWSLEPENFEK | 0.000 | 0.000 | 0.000 | 0.000 | 0.081 | 0.000 | 0.919 | 0.000 | ||
| 2 spectra, FNLMAIVSDR | 0.000 | 0.000 | 0.000 | 0.000 | 0.000 | 0.000 | 0.891 | 0.109 | ||
| 1 spectrum, QQMFEFDTK | 0.000 | 0.000 | 0.000 | 0.000 | 0.000 | 0.023 | 0.949 | 0.028 | ||
| 2 spectra, NQMLIEEEVQK | 0.000 | 0.000 | 0.000 | 0.000 | 0.000 | 0.000 | 0.896 | 0.104 | ||
| 3 spectra, GLALSNSDVIR | 0.000 | 0.000 | 0.000 | 0.000 | 0.000 | 0.000 | 0.890 | 0.110 | ||
| 2 spectra, YSEGEIR | 0.000 | 0.000 | 0.000 | 0.000 | 0.000 | 0.000 | 0.884 | 0.116 | ||
| 2 spectra, WQPGEEPAGSVVQDSR | 0.133 | 0.000 | 0.057 | 0.000 | 0.000 | 0.014 | 0.795 | 0.000 |
| Plot | Mito | Lyso or Perox | ER | Golgi | PM | Cytosol | Nucleus | ||||||
| Expt B |
3 peptides |
5 spectra |
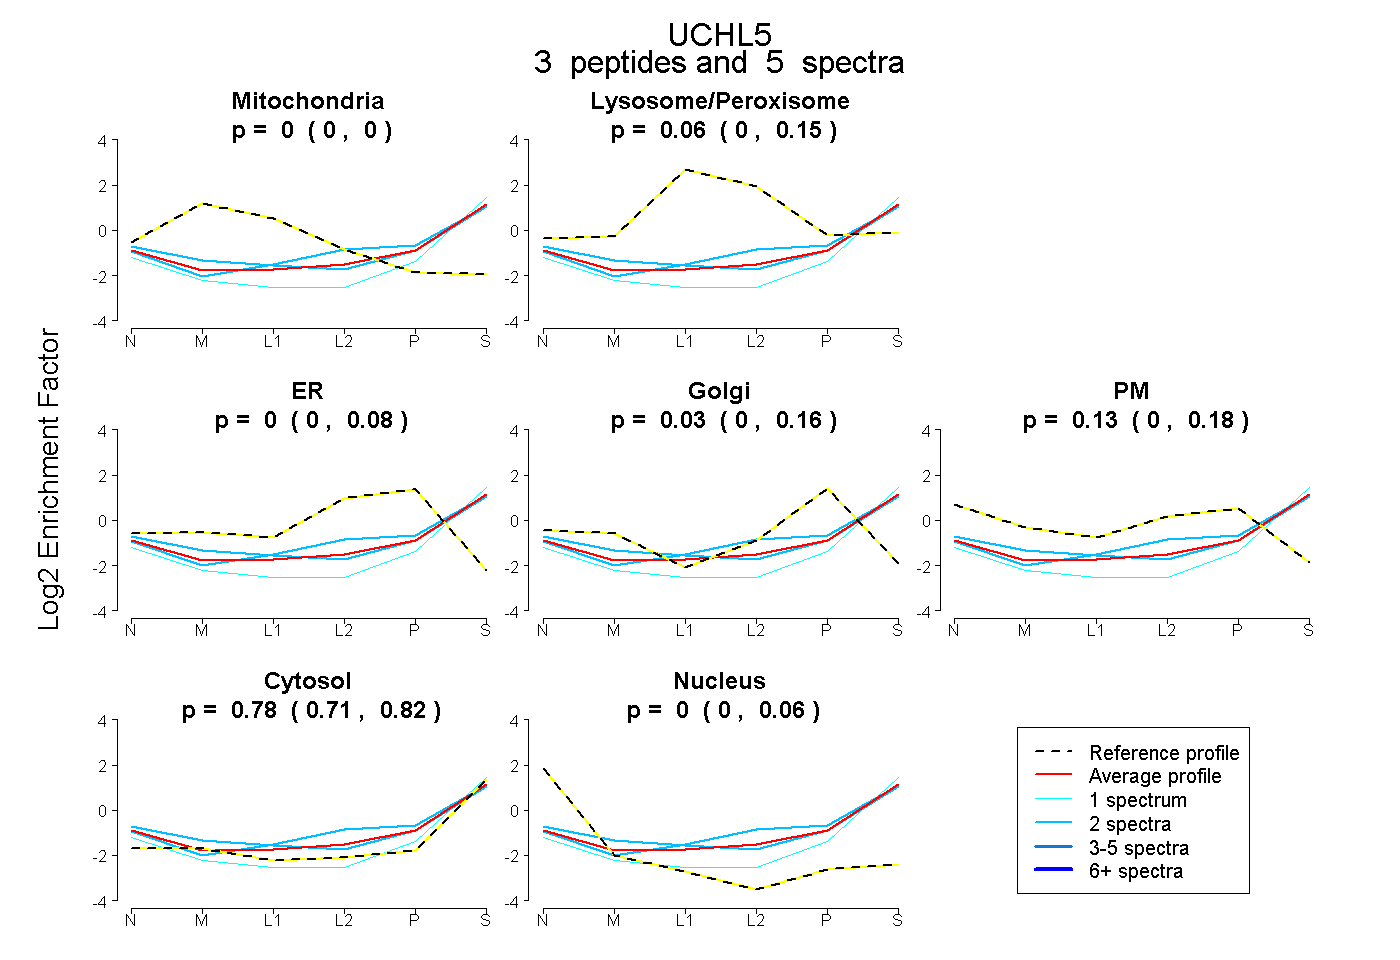 |
0.000 0.000 | 0.000 |
0.059 0.000 | 0.149 |
0.000 0.000 | 0.080 |
0.034 0.000 | 0.159 |
0.128 0.000 | 0.184 |
0.779 0.706 | 0.818 |
0.000 0.000 | 0.057 |
|||
| Plot | Lyso | Other | |||||||||||
| Expt C |
3 peptides |
4 spectra |
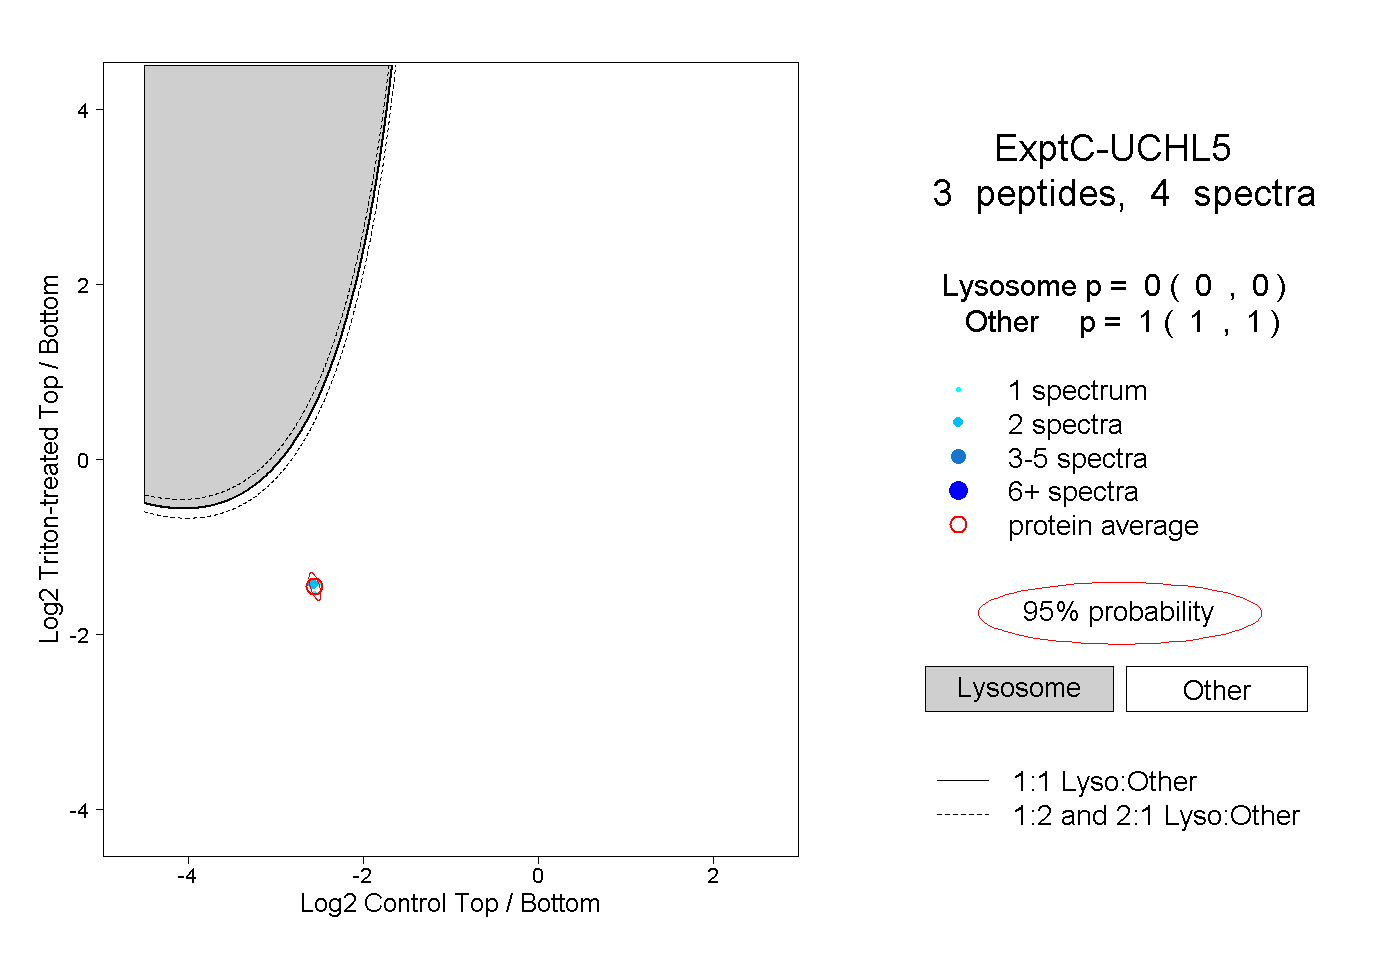 |
0.000 0.000 | 0.000 |
1.000 1.000 | 1.000 |