 9
9peptides
spectra
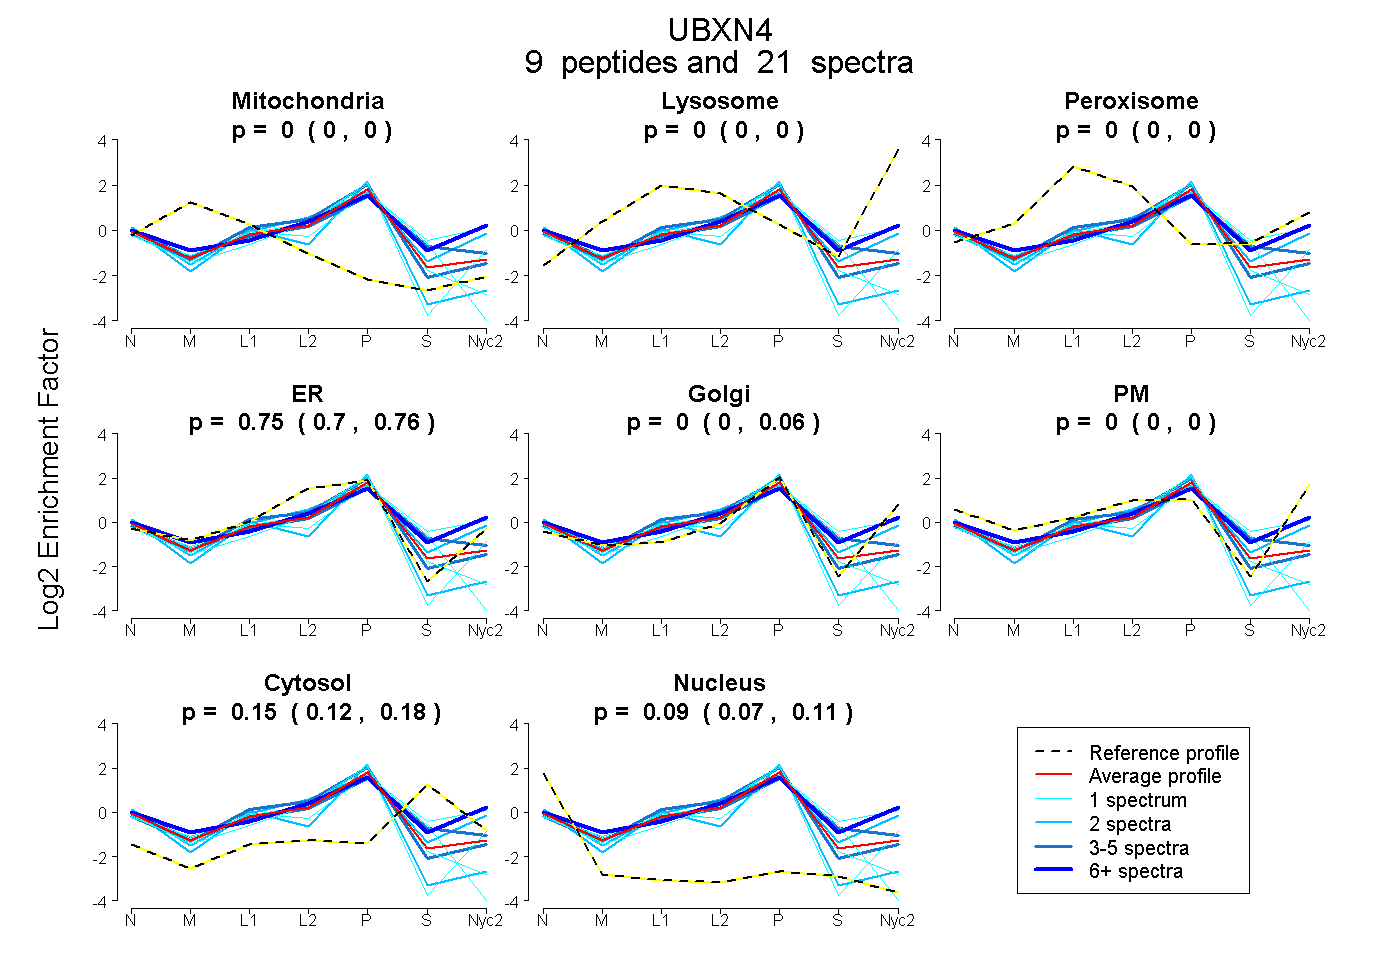
0.000 | 0.000
0.000 | 0.000
0.000 | 0.000
0.697 | 0.760
0.000 | 0.058
0.000 | 0.000
0.123 | 0.175
0.073 | 0.111
3peptides
spectra
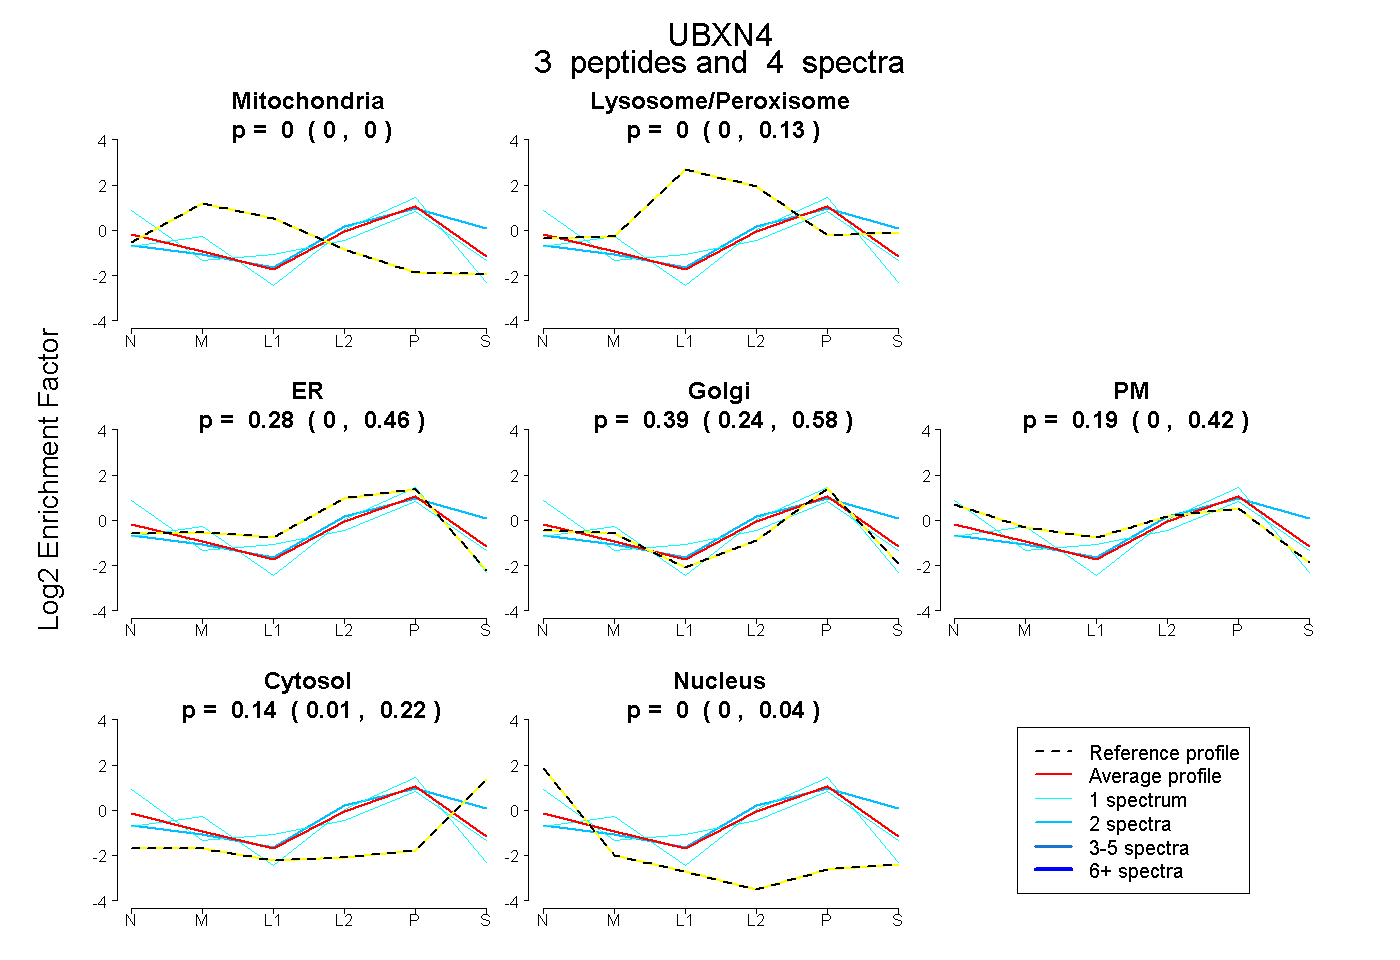
0.000 | 0.000
0.000 | 0.128
0.000 | 0.457
0.244 | 0.583
0.000 | 0.417
0.015 | 0.216
0.000 | 0.045
6peptides
spectra

0.000 | 0.000
1.000 | 1.000