UBXN4
[ENSRNOP00000004878]
Main page
| | | Plot |
Mito |
Lyso |
|
Perox |
ER |
Golgi |
PM |
Cytosol |
Nucleus |
|
| Expt A |
 9
9
peptides |
21
spectra |
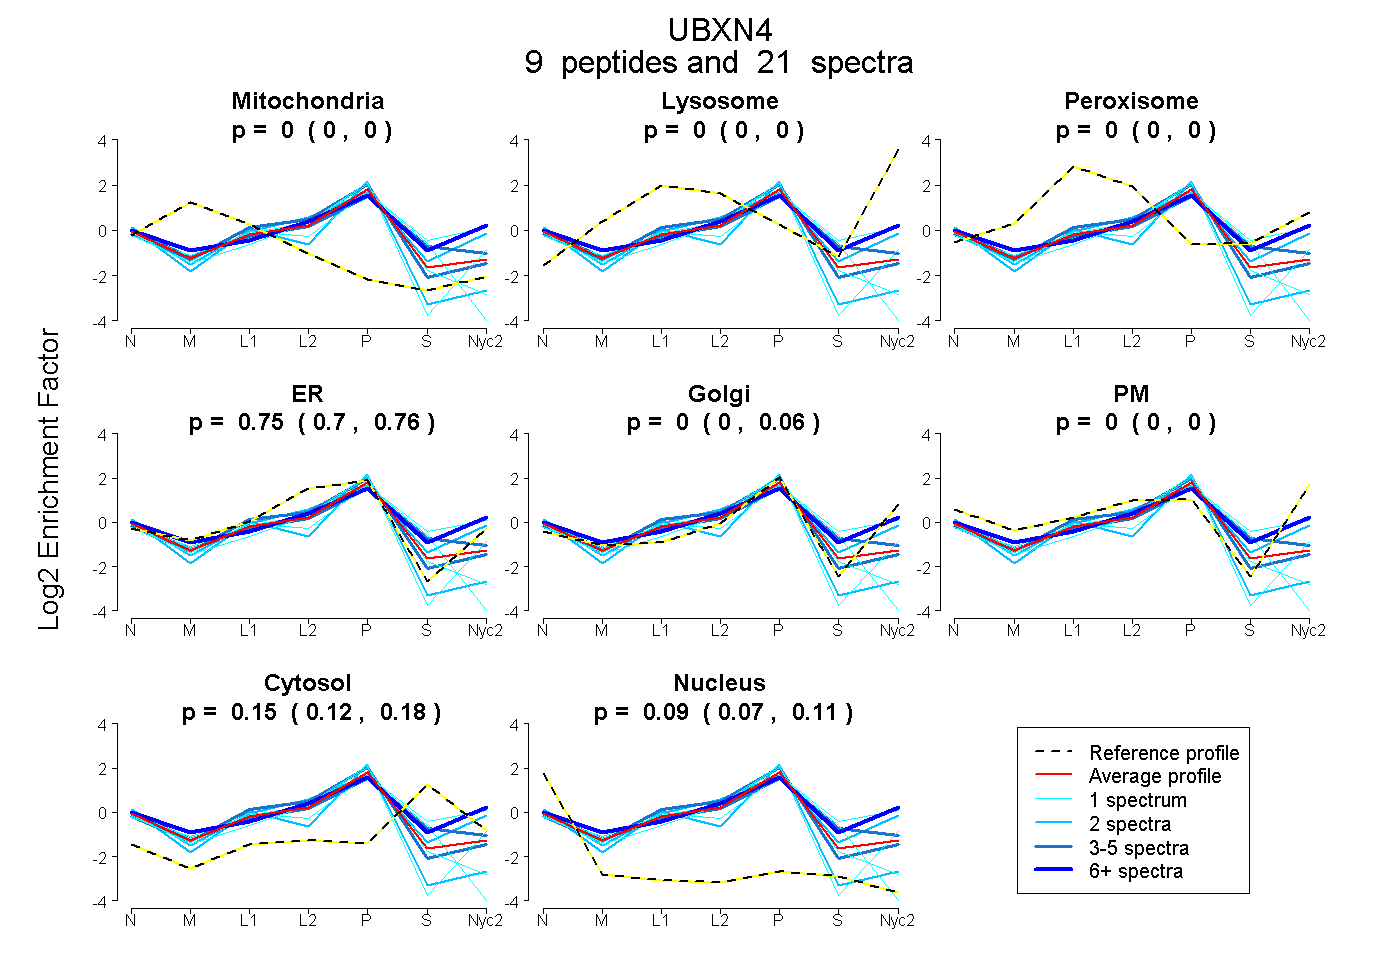 |
0.000
0.000 | 0.000 |
0.000
0.000 | 0.000 |
|
0.000
0.000 | 0.000 |
0.749
0.697 | 0.760 |
0.003
0.000 | 0.058 |
0.000
0.000 | 0.000 |
0.153
0.123 | 0.175 |
0.094
0.073 | 0.111 |
|
| | | Plot |
Mito |
|
Lyso or Perox |
|
ER |
Golgi |
PM |
Cytosol |
Nucleus |
|
| Expt B |
3
peptides |
4
spectra |
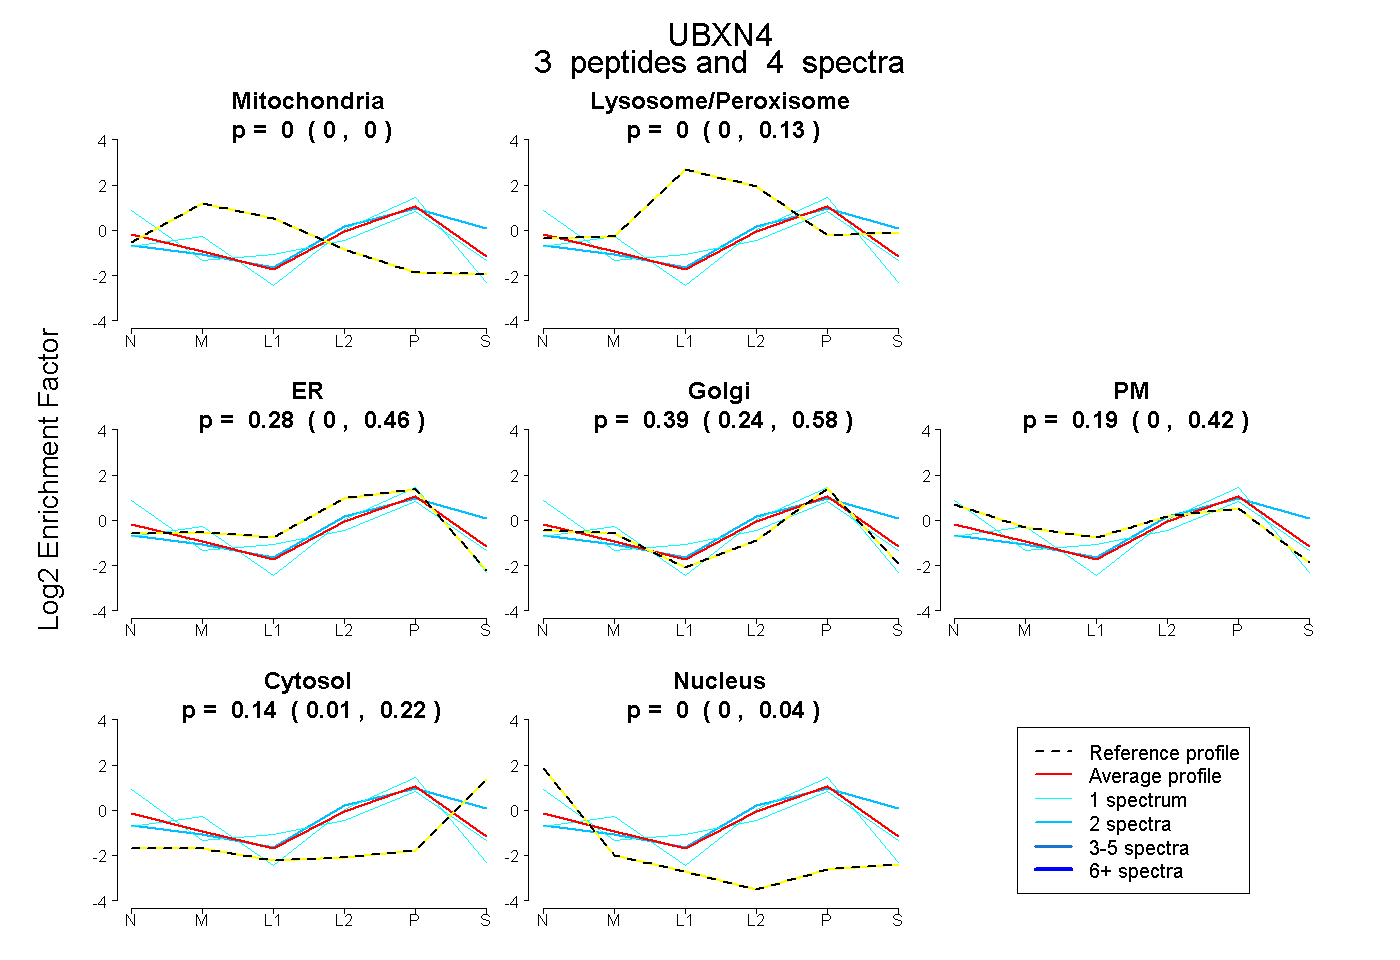 |
0.000
0.000 | 0.000 |
|
0.000
0.000 | 0.128 |
|
0.284
0.000 | 0.457 |
0.385
0.244 | 0.583 |
0.190
0.000 | 0.417 |
0.140
0.015 | 0.216 |
0.000
0.000 | 0.045 |
|
| 2 spectra, AAALLAK |
0.000 |
|
0.029 |
|
0.526 |
0.090 |
0.000 |
0.355 |
0.000 |
|
| 1 spectrum, VQQMHSLK |
0.000 |
|
0.057 |
|
0.000 |
0.261 |
0.558 |
0.023 |
0.101 |
|
| 1 spectrum, QQIALDR |
0.000 |
|
0.000 |
|
0.264 |
0.736 |
0.000 |
0.000 |
0.000 |
|
| | | Plot |
|
Lyso |
|
|
|
|
|
|
|
Other |
| Expt C |
6
peptides |
23
spectra |
 |
|
0.000
0.000 | 0.000 |
|
|
|
|
|
|
|
1.000
1.000 | 1.000 |