 6
6peptides
spectra
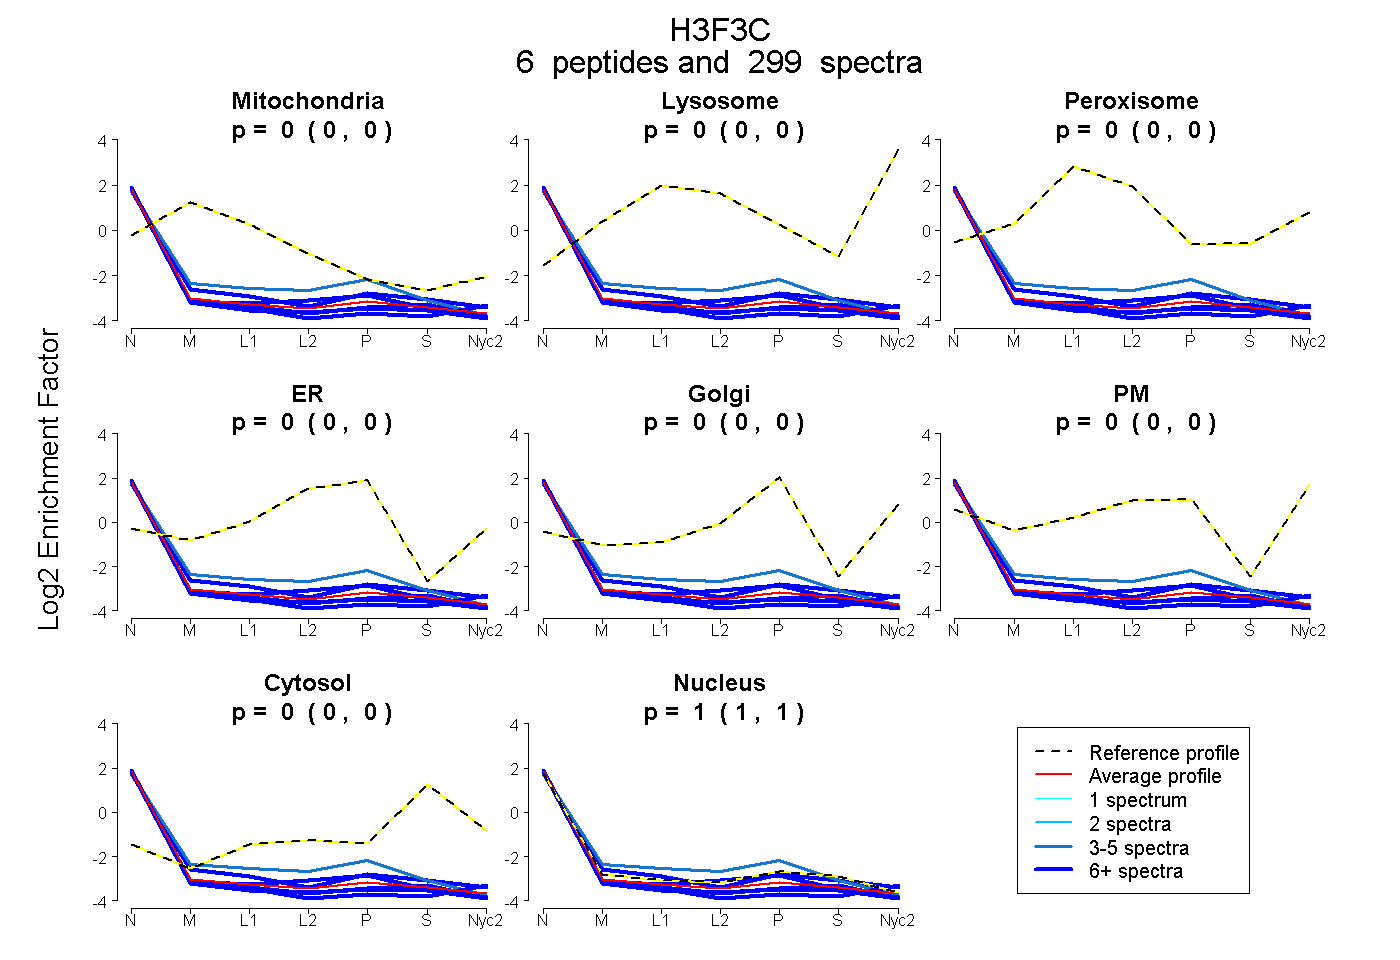
0.000 | 0.000
0.000 | 0.000
0.000 | 0.000
0.000 | 0.000
0.000 | 0.000
0.000 | 0.000
0.000 | 0.000
1.000 | 1.000
4peptides
spectra
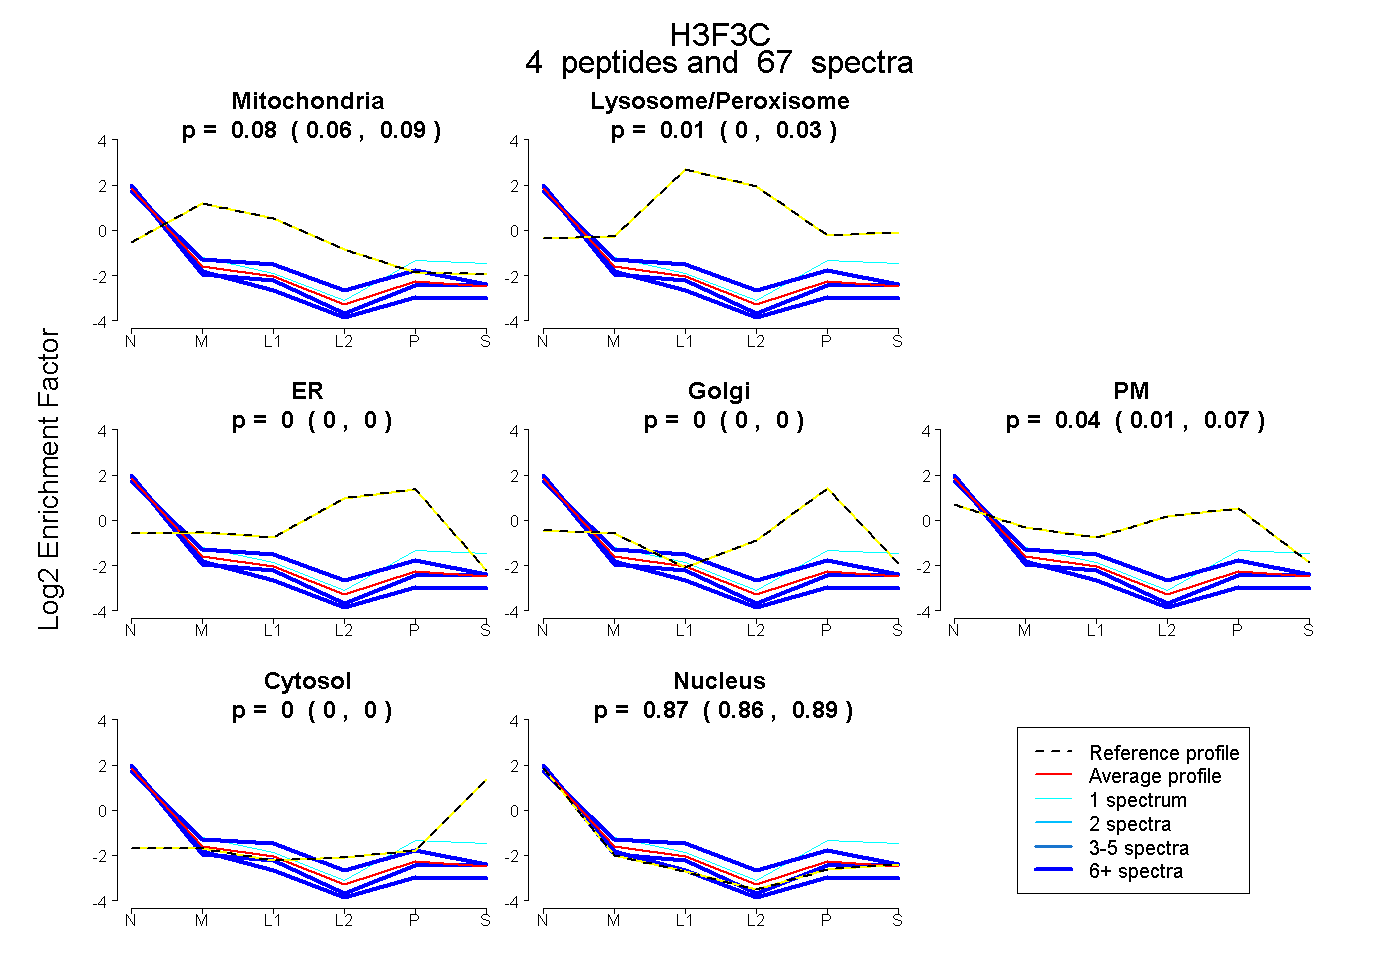
0.059 | 0.092
0.000 | 0.025
0.000 | 0.000
0.000 | 0.000
0.009 | 0.065
0.000 | 0.000
0.859 | 0.886