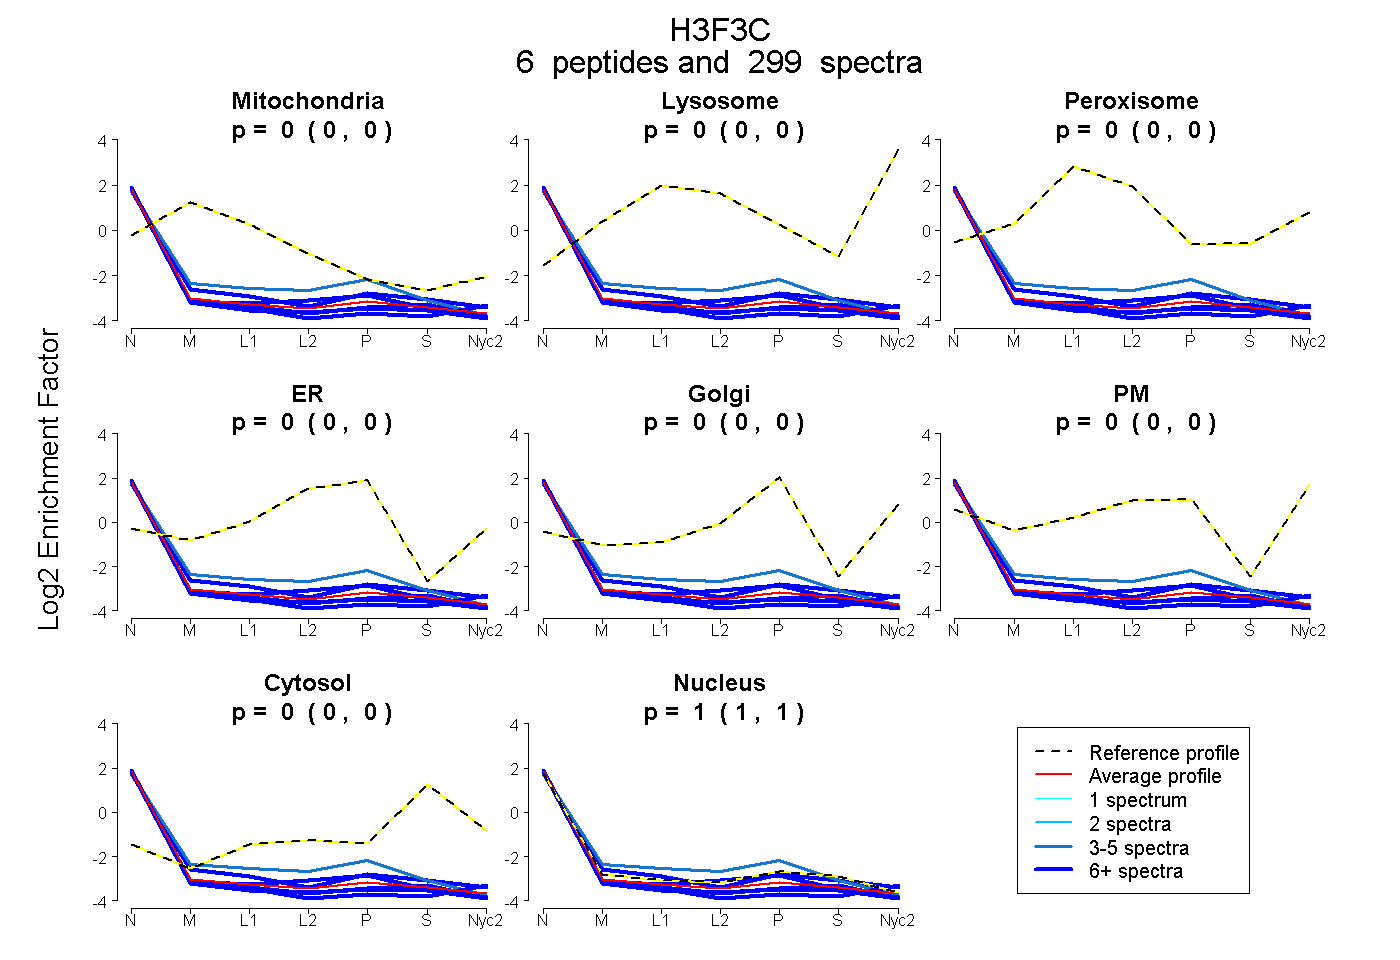
 6
6peptides
spectra
0.000 | 0.000
0.000 | 0.000
0.000 | 0.000
0.000 | 0.000
0.000 | 0.000
0.000 | 0.000
0.000 | 0.000
1.000 | 1.000
| Plot | Mito | Lyso | Perox | ER | Golgi | PM | Cytosol | Nucleus | |||||
| Expt A |
6 peptides |
299 spectra |
|
0.000 0.000 | 0.000 |
0.000 0.000 | 0.000 |
0.000 0.000 | 0.000 |
0.000 0.000 | 0.000 |
0.000 0.000 | 0.000 |
0.000 0.000 | 0.000 |
0.000 0.000 | 0.000 |
1.000 1.000 | 1.000 |
| 18 spectra, VTIMPK | 0.000 | 0.000 | 0.000 | 0.000 | 0.000 | 0.000 | 0.000 | 1.000 | ||
| 88 spectra, DIQLAR | 0.000 | 0.000 | 0.000 | 0.000 | 0.000 | 0.000 | 0.000 | 1.000 | ||
| 66 spectra, EIAQDFK | 0.030 | 0.000 | 0.000 | 0.000 | 0.000 | 0.000 | 0.000 | 0.970 | ||
| 86 spectra, YRPGTVALR | 0.000 | 0.000 | 0.000 | 0.000 | 0.000 | 0.000 | 0.000 | 1.000 | ||
| 38 spectra, STELLIR | 0.000 | 0.000 | 0.000 | 0.000 | 0.000 | 0.000 | 0.000 | 1.000 | ||
| 3 spectra, SAPSTGGVK | 0.056 | 0.000 | 0.000 | 0.060 | 0.000 | 0.000 | 0.000 | 0.884 |
| Plot | Mito | Lyso or Perox | ER | Golgi | PM | Cytosol | Nucleus | ||||||
| Expt B |
4 peptides |
67 spectra |
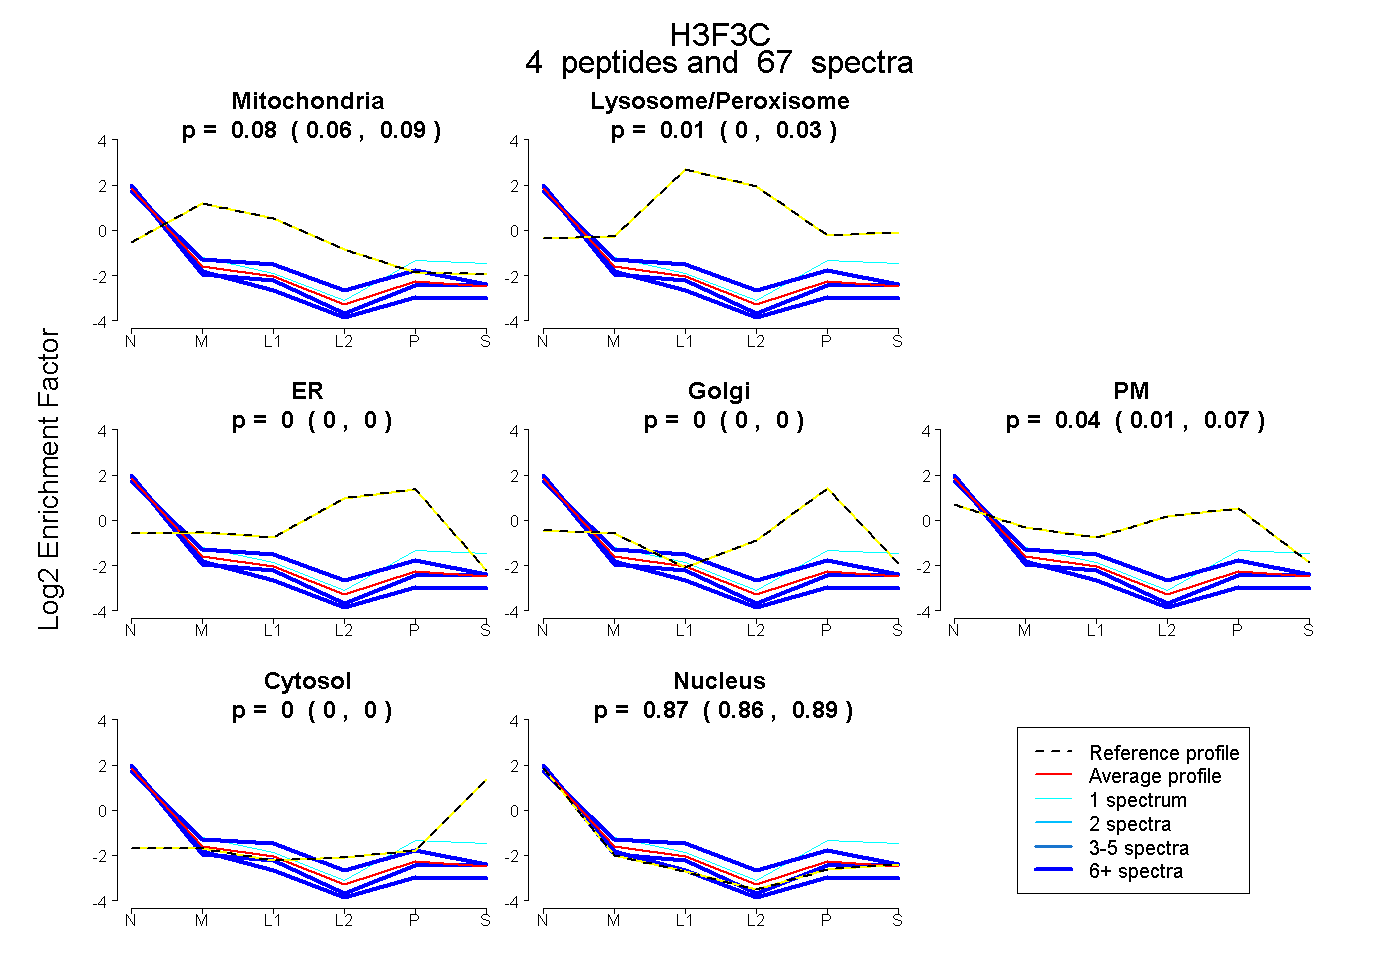 |
0.077 0.059 | 0.092 |
0.008 0.000 | 0.025 |
0.000 0.000 | 0.000 |
0.000 0.000 | 0.000 |
0.041 0.009 | 0.065 |
0.000 0.000 | 0.000 |
0.873 0.859 | 0.886 |