 5
5peptides
spectra

0.000 | 0.000
0.000 | 0.000
0.000 | 0.000
0.000 | 0.004
0.037 | 0.097
0.000 | 0.000
0.694 | 0.713
0.190 | 0.244
2peptides
spectra
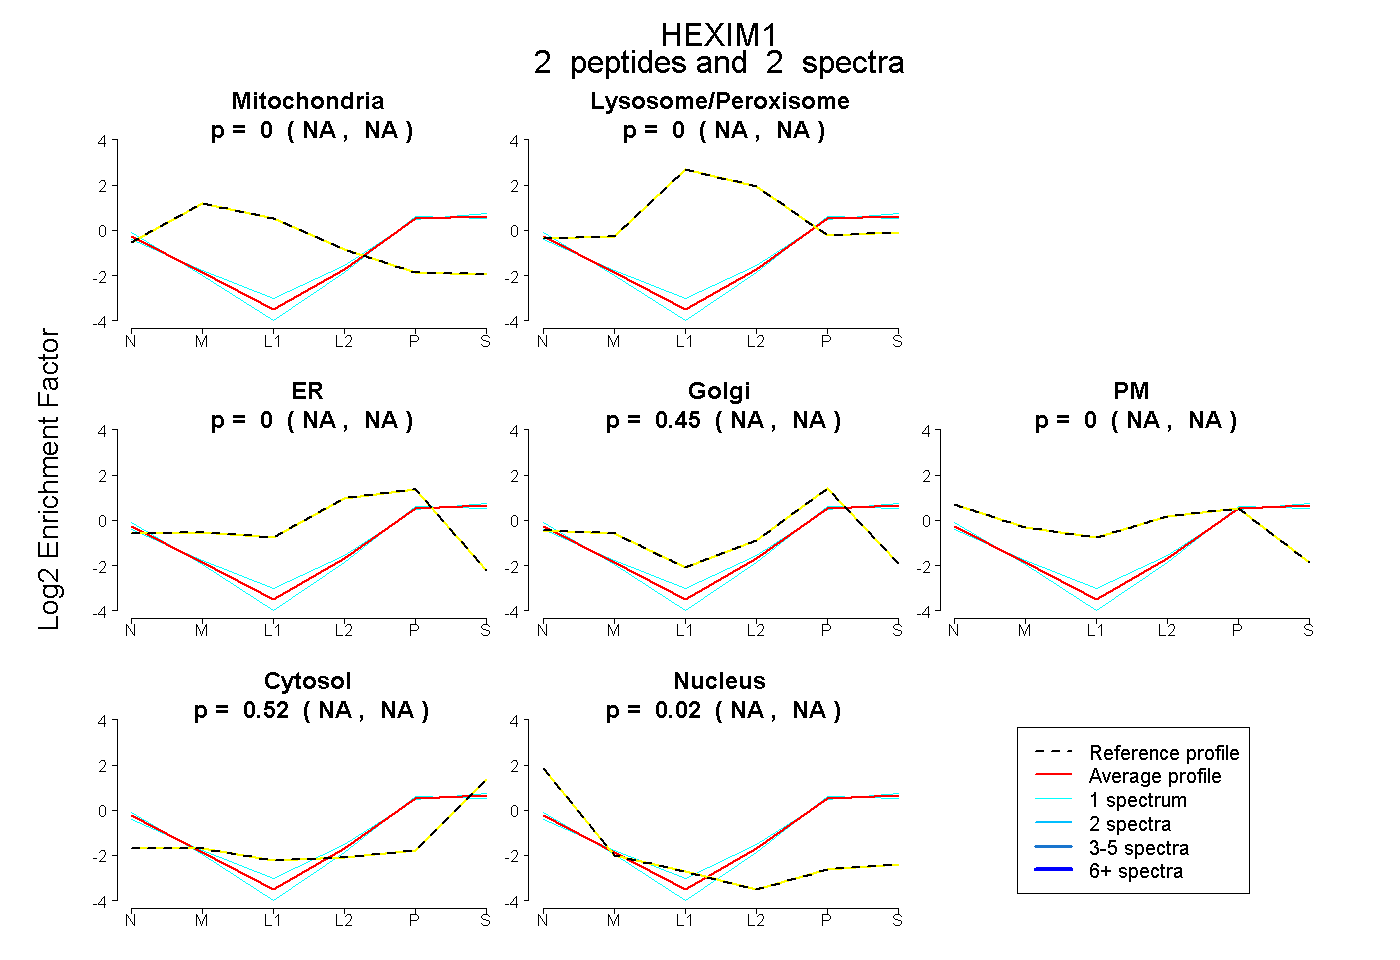
NA | NA
NA | NA
NA | NA
NA | NA
NA | NA
NA | NA
NA | NA
1peptide
spectra
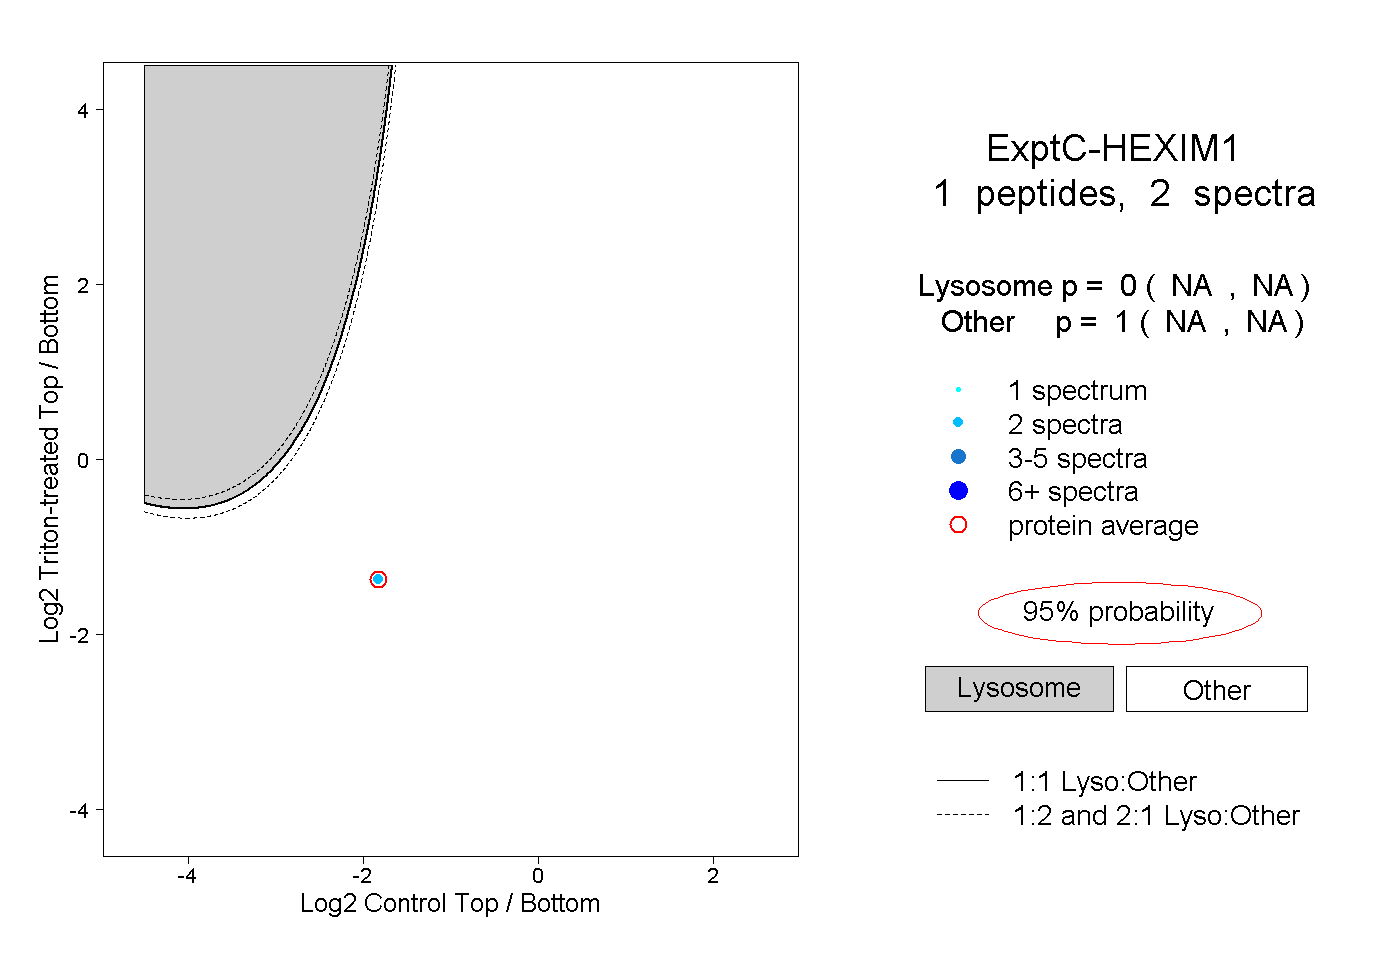
NA | NA
NA | NA