 5
5peptides
spectra

0.000 | 0.000
0.000 | 0.000
0.000 | 0.000
0.000 | 0.004
0.037 | 0.097
0.000 | 0.000
0.694 | 0.713
0.190 | 0.244
2peptides
spectra
NA | NA
NA | NA
NA | NA
NA | NA
NA | NA
NA | NA
NA | NA
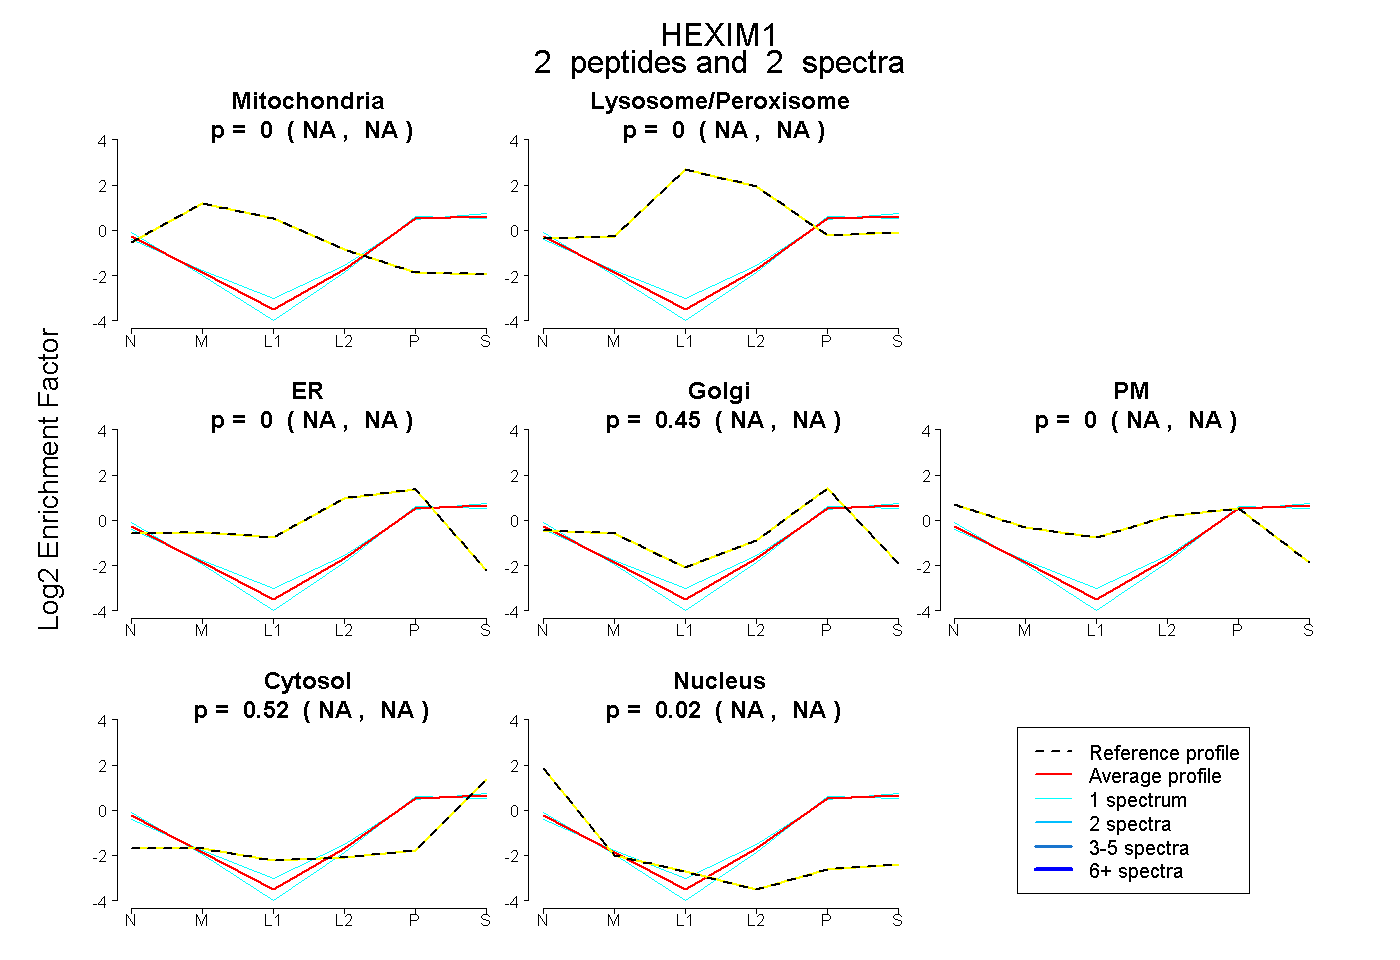
| Plot | Mito | Lyso | Perox | ER | Golgi | PM | Cytosol | Nucleus | |||||
| Expt A |
5 peptides |
17 spectra |
|
0.000 0.000 | 0.000 |
0.000 0.000 | 0.000 |
0.000 0.000 | 0.000 |
0.000 0.000 | 0.004 |
0.075 0.037 | 0.097 |
0.000 0.000 | 0.000 |
0.704 0.694 | 0.713 |
0.220 0.190 | 0.244 |
||
| Plot | Mito | Lyso or Perox | ER | Golgi | PM | Cytosol | Nucleus | ||||||
| Expt B |
2 peptides |
2 spectra |
|
0.000 NA | NA |
0.000 NA | NA |
0.000 NA | NA |
0.453 NA | NA |
0.000 NA | NA |
0.525 NA | NA |
0.023 NA | NA |
| 1 spectrum, DFSETYER | 0.000 | 0.000 | 0.000 | 0.443 | 0.000 | 0.485 | 0.072 | |||
| 1 spectrum, ELELELDR | 0.000 | 0.000 | 0.000 | 0.449 | 0.000 | 0.551 | 0.000 |
| Plot | Lyso | Other | |||||||||||
| Expt C |
1 peptide |
2 spectra |
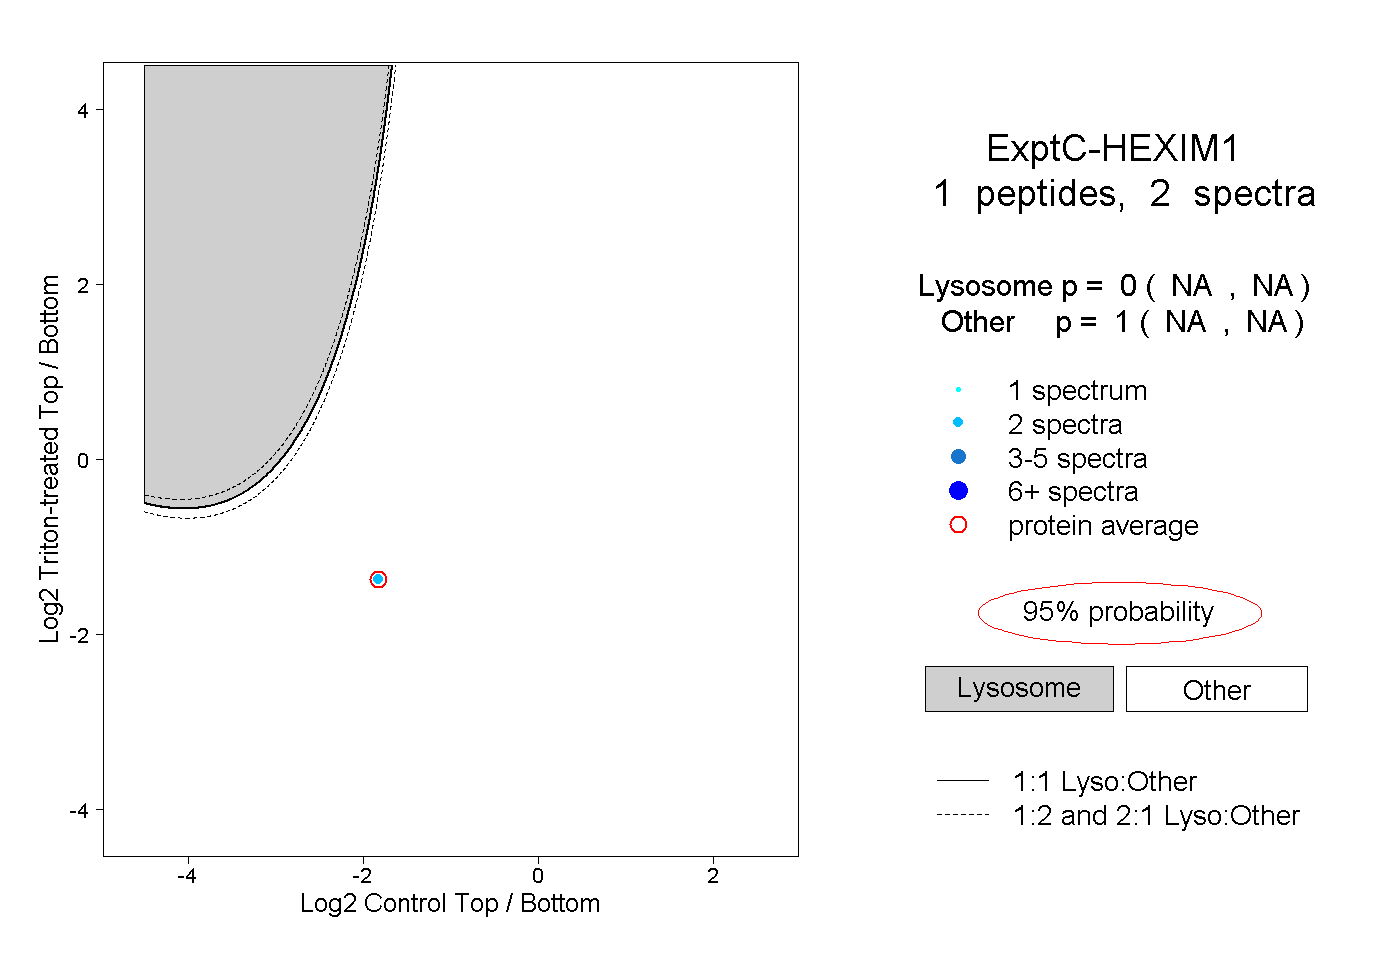 |
0.000 NA | NA |
1.000 NA | NA |