 4
4peptides
spectra
0.000 | 0.000
0.035 | 0.169
0.724 | 0.858
0.013 | 0.132
0.000 | 0.037
0.000 | 0.000
0.000 | 0.000
0.000 | 0.000
5peptides
spectra
0.000 | 0.000
1.000 | 1.000
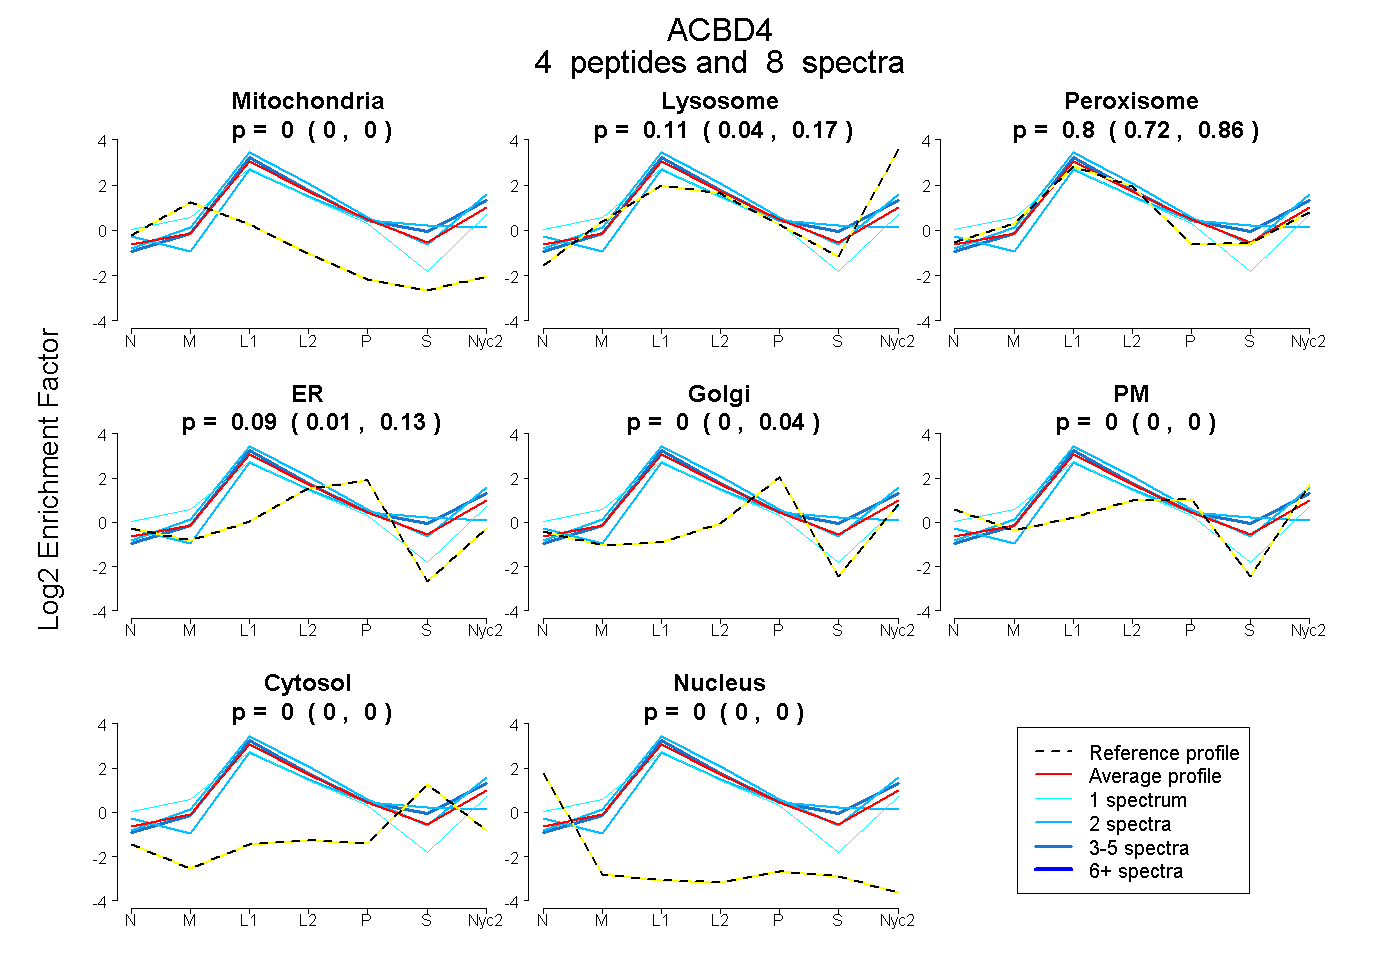
| Plot | Mito | Lyso | Perox | ER | Golgi | PM | Cytosol | Nucleus | |||||
| Expt A |
4 peptides |
8 spectra |
|
0.000 0.000 | 0.000 |
0.110 0.035 | 0.169 |
0.796 0.724 | 0.858 |
0.094 0.013 | 0.132 |
0.000 0.000 | 0.037 |
0.000 0.000 | 0.000 |
0.000 0.000 | 0.000 |
0.000 0.000 | 0.000 |
||
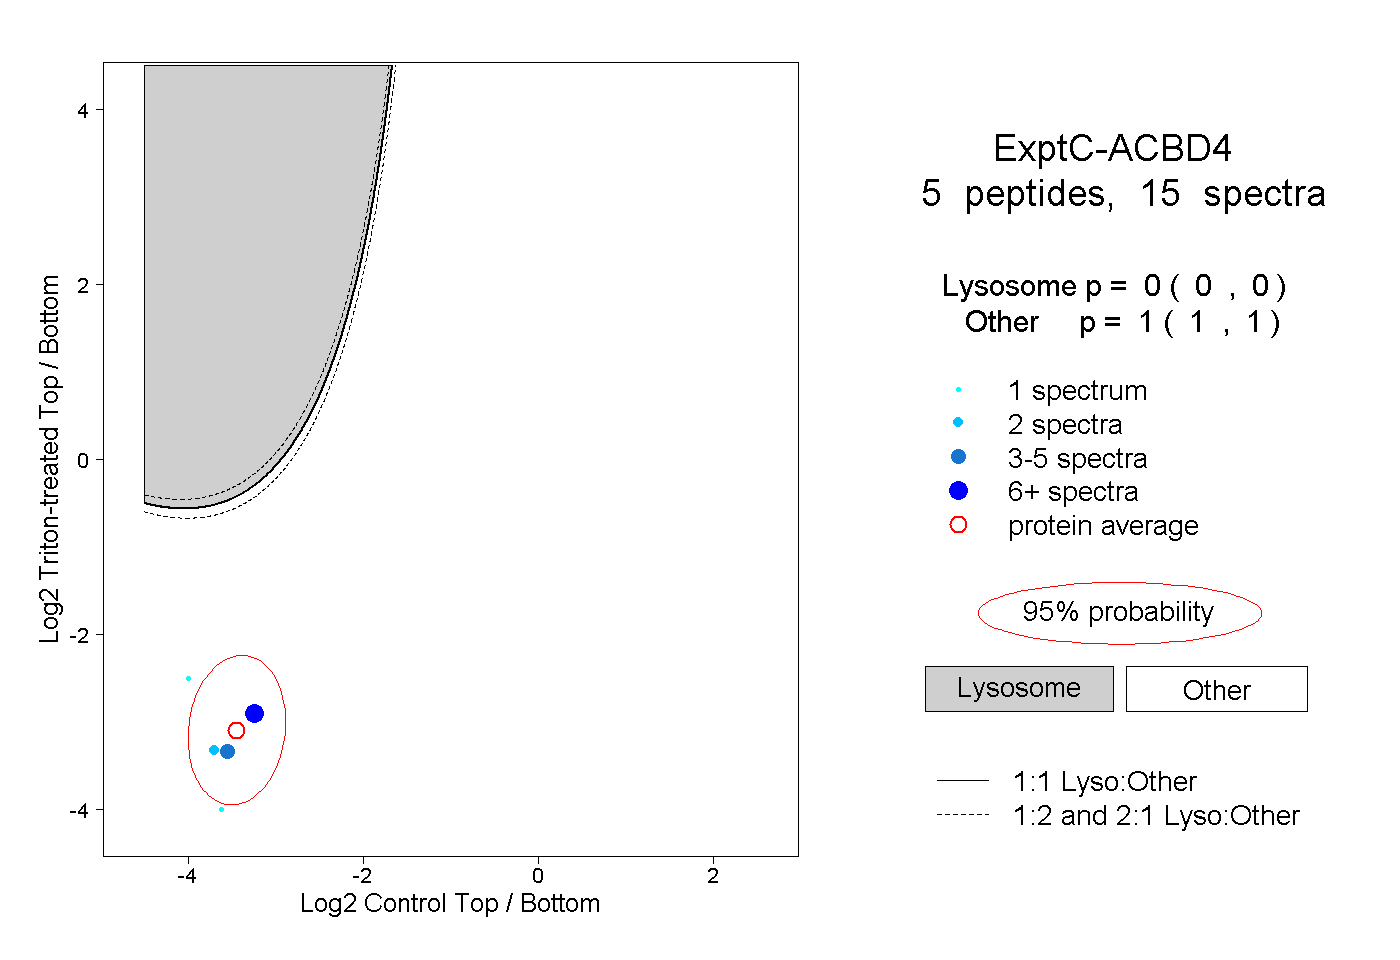
| Plot | Lyso | Other | |||||||||||
| Expt C |
5 peptides |
15 spectra |
|
0.000 0.000 | 0.000 |
1.000 1.000 | 1.000 |