 4
4peptides
spectra
0.000 | 0.000
0.035 | 0.169
0.724 | 0.858
0.013 | 0.132
0.000 | 0.037
0.000 | 0.000
0.000 | 0.000
0.000 | 0.000
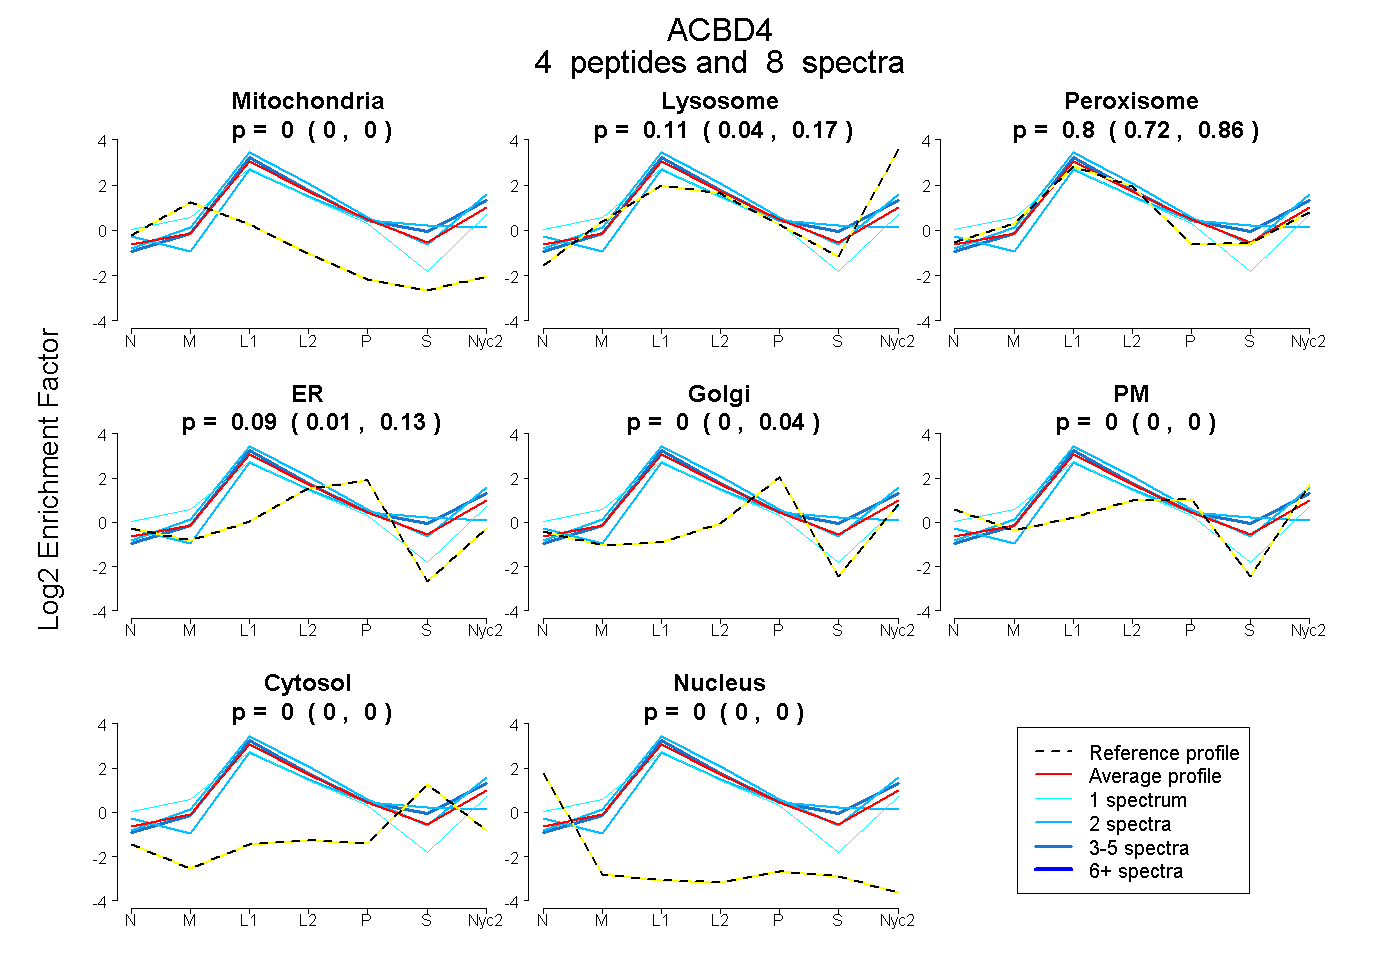
| Plot | Mito | Lyso | Perox | ER | Golgi | PM | Cytosol | Nucleus | |||||
| Expt A |
4 peptides |
8 spectra |
|
0.000 0.000 | 0.000 |
0.110 0.035 | 0.169 |
0.796 0.724 | 0.858 |
0.094 0.013 | 0.132 |
0.000 0.000 | 0.037 |
0.000 0.000 | 0.000 |
0.000 0.000 | 0.000 |
0.000 0.000 | 0.000 |
| 2 spectra, QATAGPCLVPRPGFWDPIGR | 0.000 | 0.282 | 0.718 | 0.000 | 0.000 | 0.000 | 0.000 | 0.000 | ||
| 2 spectra, VTGWQEPAVNR | 0.000 | 0.000 | 0.772 | 0.094 | 0.000 | 0.000 | 0.134 | 0.000 | ||
| 1 spectrum, WLVGTVQAMQESMK | 0.031 | 0.000 | 0.685 | 0.079 | 0.000 | 0.205 | 0.000 | 0.000 | ||
| 3 spectra, EEAMSAYITEMK | 0.000 | 0.198 | 0.802 | 0.000 | 0.000 | 0.000 | 0.000 | 0.000 |
| Plot | Lyso | Other | |||||||||||
| Expt C |
5 peptides |
15 spectra |
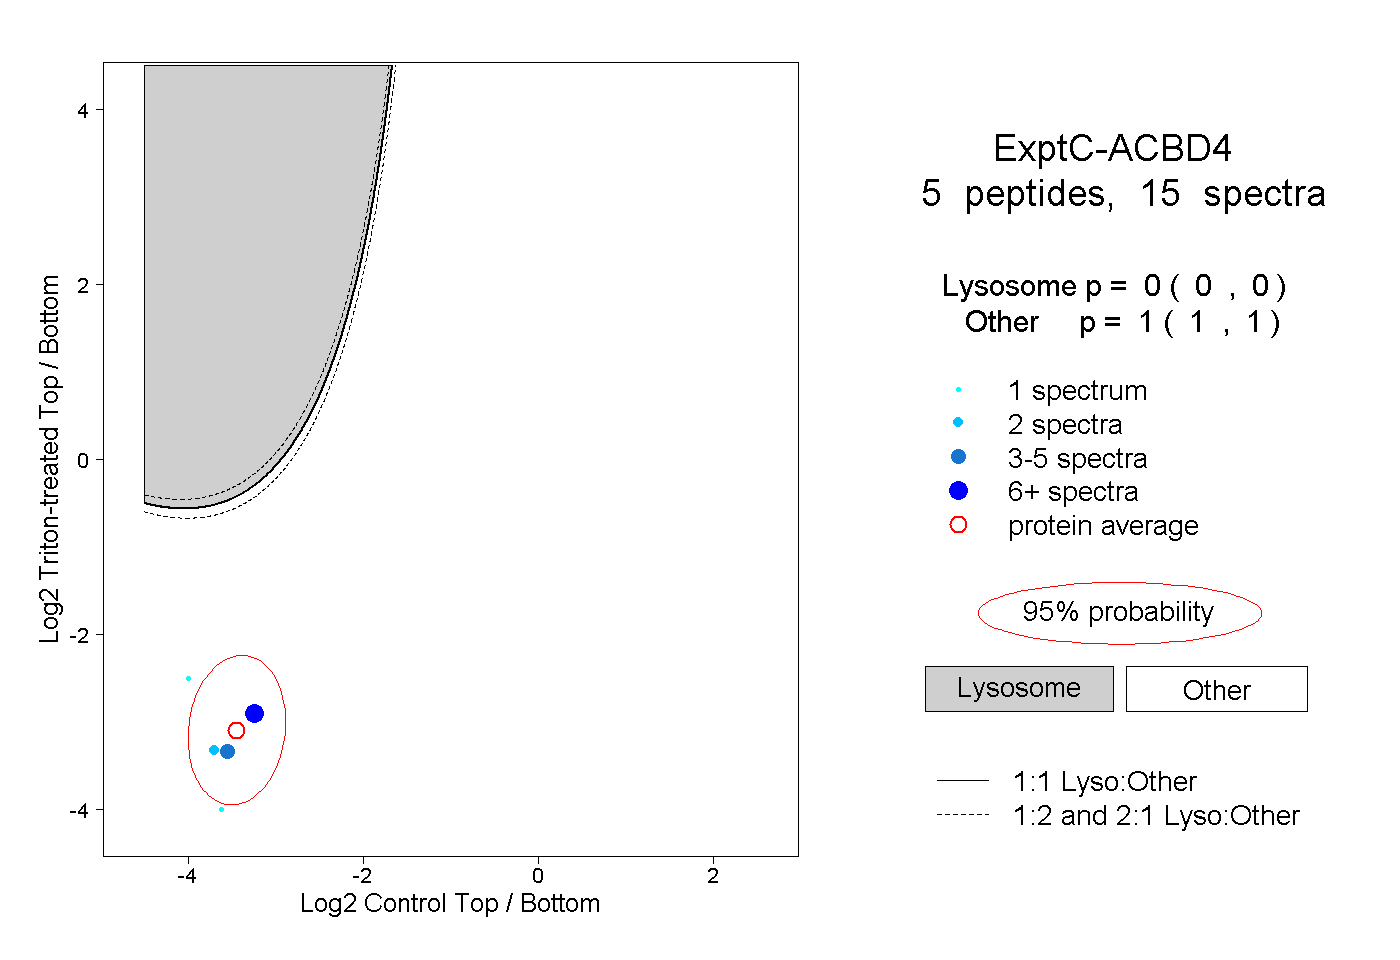 |
0.000 0.000 | 0.000 |
1.000 1.000 | 1.000 |