 10
10peptides
spectra
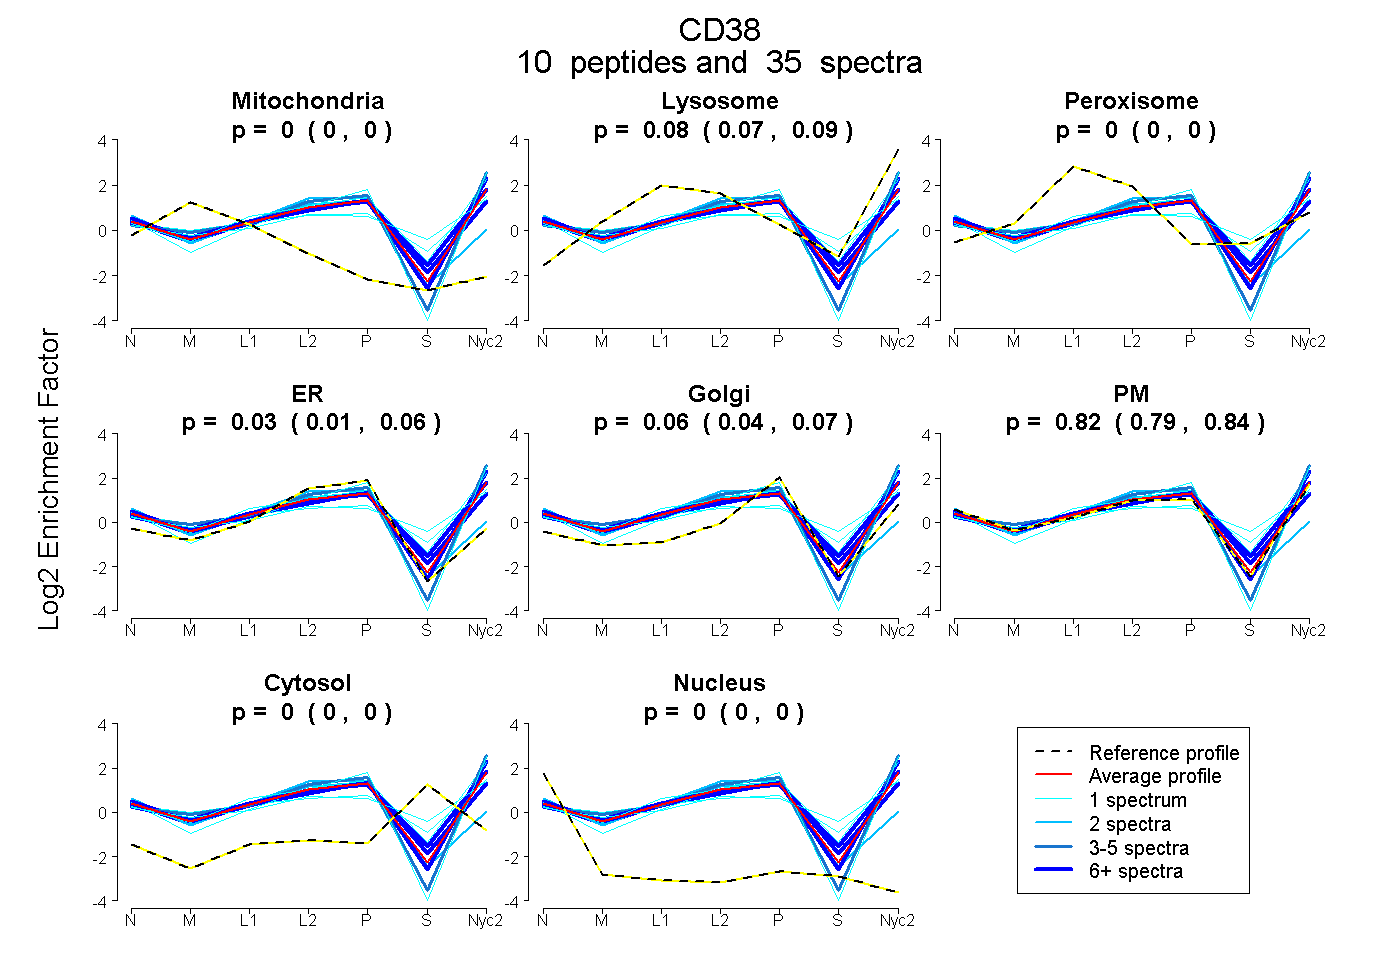
0.000 | 0.000
0.069 | 0.095
0.000 | 0.000
0.008 | 0.061
0.044 | 0.074
0.795 | 0.840
0.000 | 0.000
0.000 | 0.000
4peptides
spectra
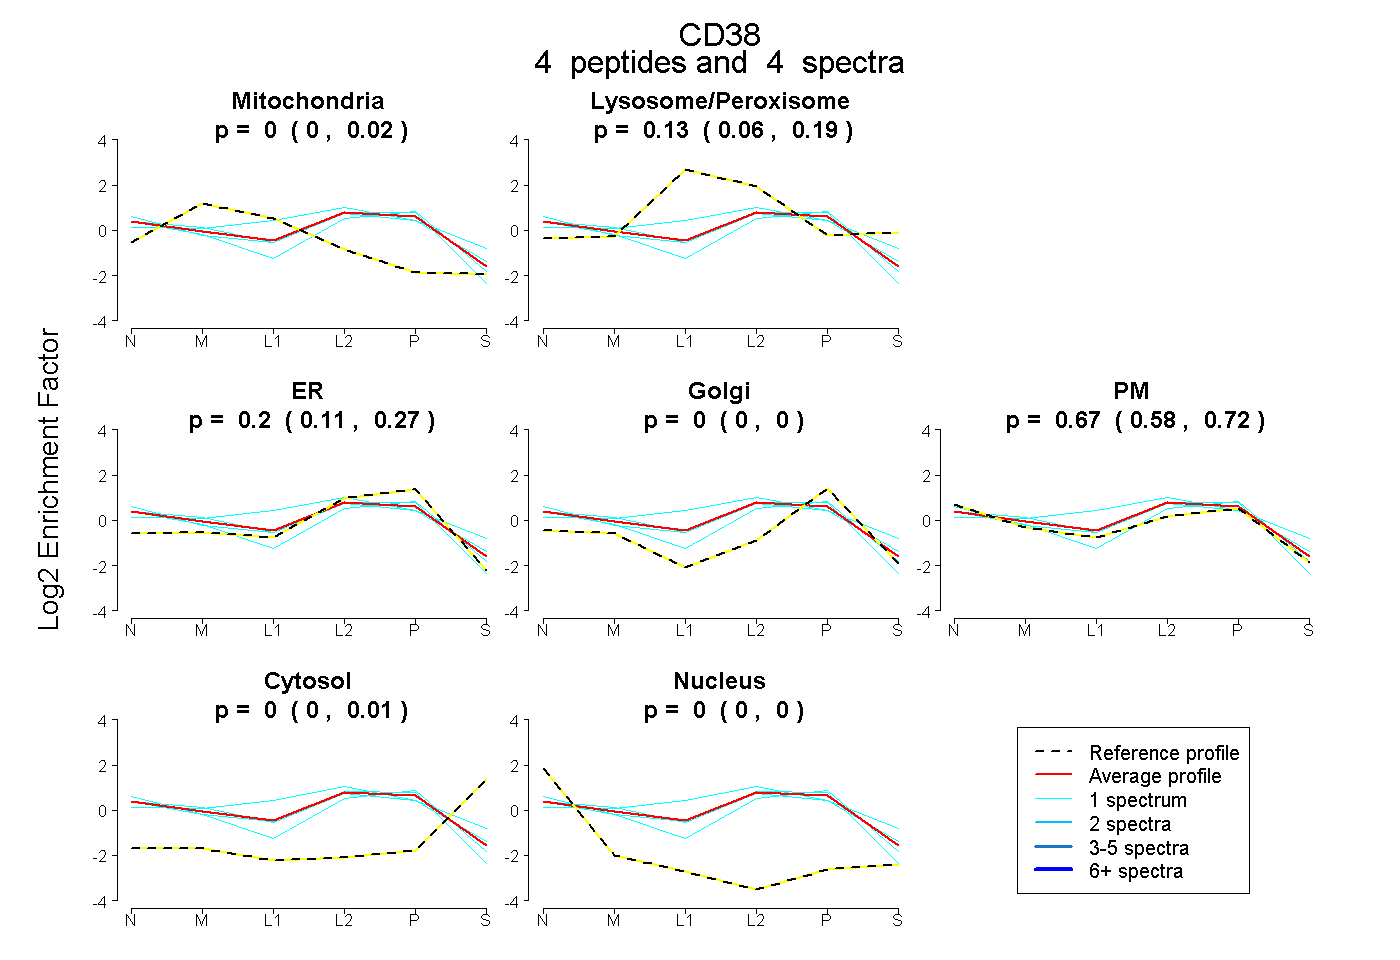
0.000 | 0.024
0.064 | 0.192
0.114 | 0.270
0.000 | 0.000
0.585 | 0.719
0.000 | 0.013
0.000 | 0.000
9peptides
spectra
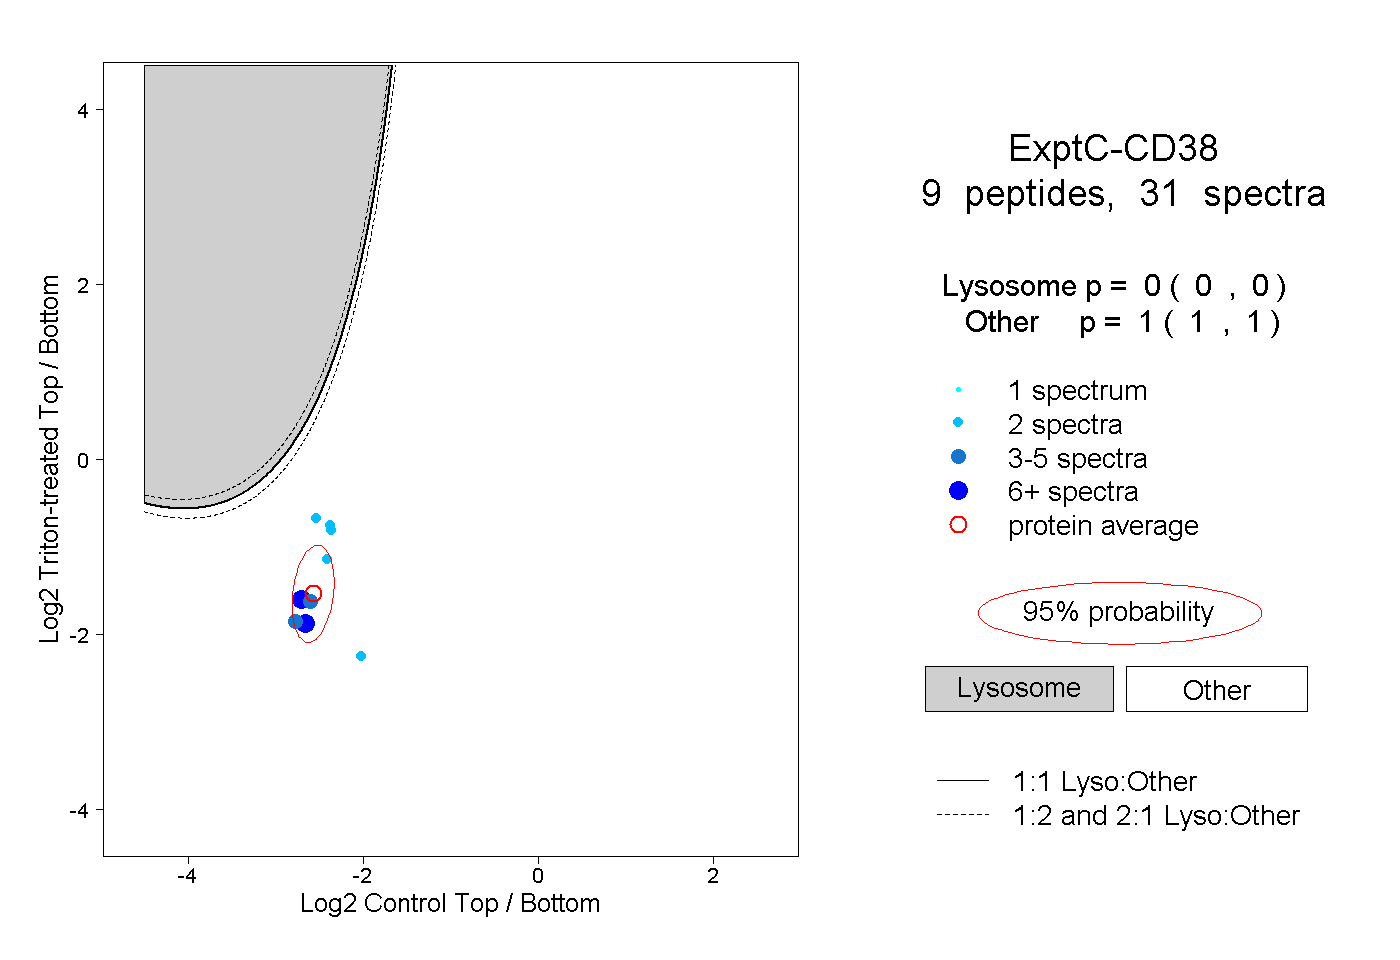
0.000 | 0.000
1.000 | 1.000
2peptides
spectra
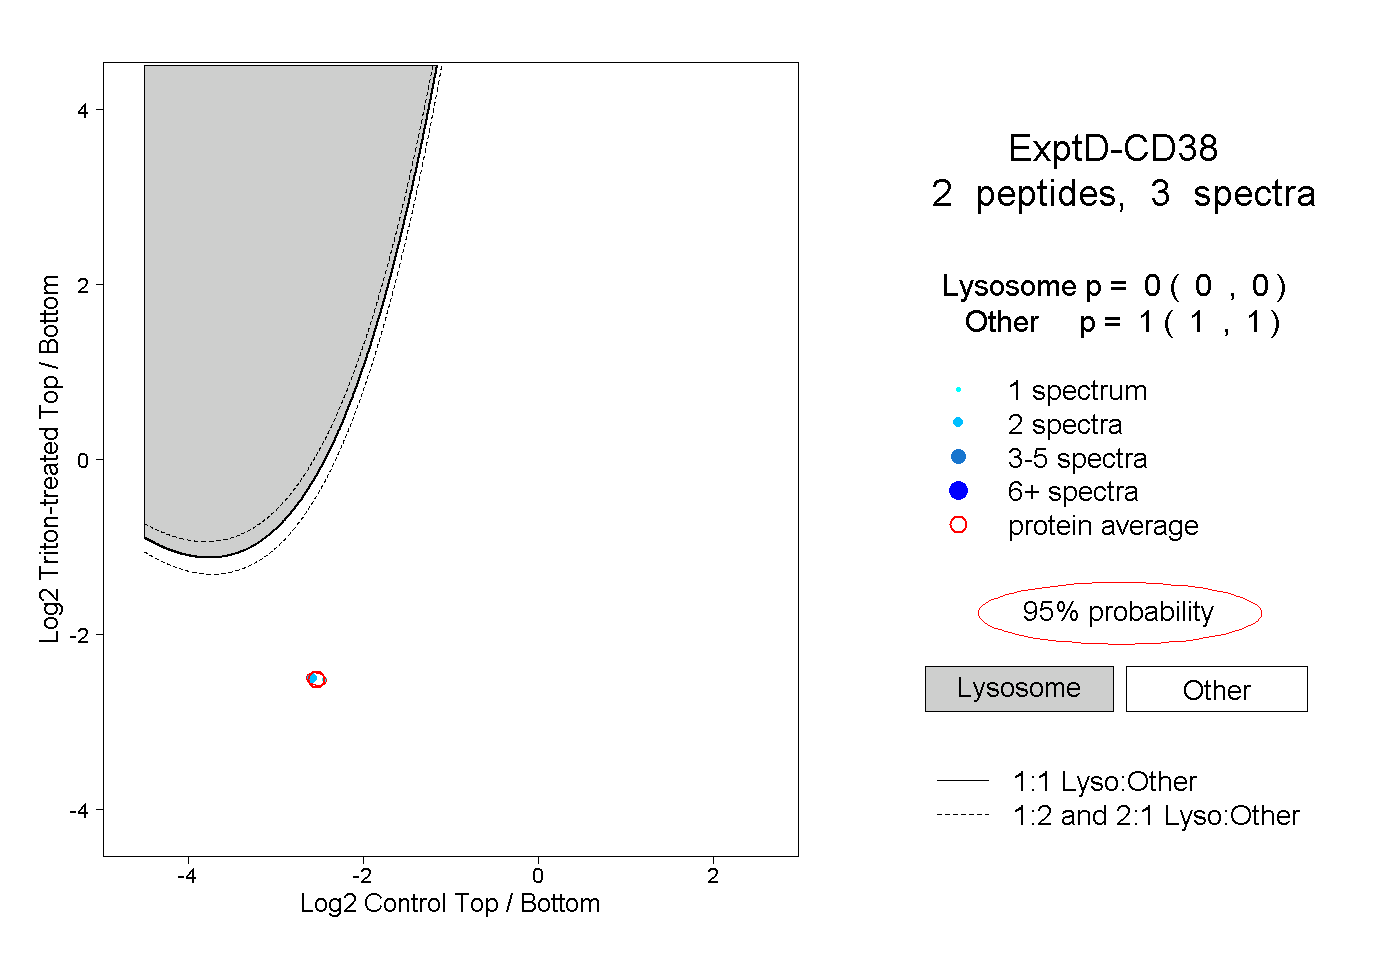
0.000 | 0.000
1.000 | 1.000