 10
10peptides
spectra
0.000 | 0.000
0.069 | 0.095
0.000 | 0.000
0.008 | 0.061
0.044 | 0.074
0.795 | 0.840
0.000 | 0.000
0.000 | 0.000
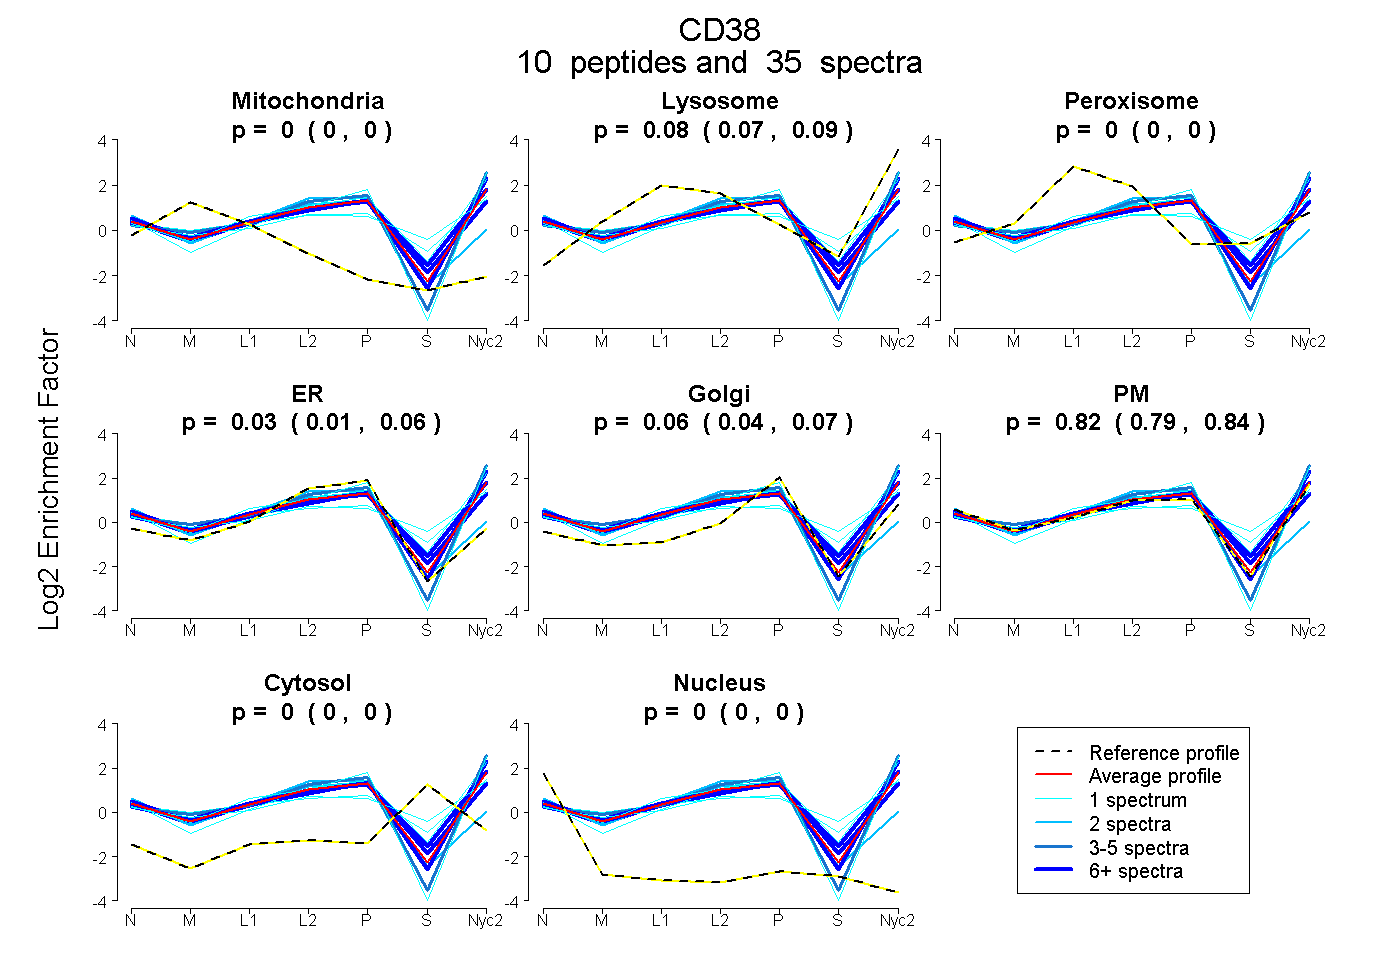
| Plot | Mito | Lyso | Perox | ER | Golgi | PM | Cytosol | Nucleus | |||||
| Expt A |
10 peptides |
35 spectra |
|
0.000 0.000 | 0.000 |
0.084 0.069 | 0.095 |
0.000 0.000 | 0.000 |
0.034 0.008 | 0.061 |
0.061 0.044 | 0.074 |
0.820 0.795 | 0.840 |
0.000 0.000 | 0.000 |
0.000 0.000 | 0.000 |
| 3 spectra, LQAWVMHDIK | 0.000 | 0.079 | 0.000 | 0.000 | 0.000 | 0.921 | 0.000 | 0.000 | ||
| 1 spectrum, GTSSNACSSPSINELK | 0.000 | 0.102 | 0.118 | 0.000 | 0.000 | 0.630 | 0.149 | 0.000 | ||
| 2 spectra, FLQCVK | 0.000 | 0.000 | 0.000 | 0.000 | 0.000 | 1.000 | 0.000 | 0.000 | ||
| 1 spectrum, TLFWSK | 0.000 | 0.019 | 0.000 | 0.000 | 0.000 | 0.981 | 0.000 | 0.000 | ||
| 6 spectra, ANYEFSQVSEDRPGCR | 0.000 | 0.000 | 0.140 | 0.018 | 0.240 | 0.594 | 0.007 | 0.000 | ||
| 7 spectra, HFADIILGR | 0.000 | 0.069 | 0.000 | 0.000 | 0.000 | 0.931 | 0.000 | 0.000 | ||
| 2 spectra, CLIYTQILRPEMR | 0.022 | 0.000 | 0.076 | 0.546 | 0.000 | 0.314 | 0.000 | 0.042 | ||
| 1 spectrum, NPEHPSCR | 0.000 | 0.125 | 0.106 | 0.000 | 0.000 | 0.536 | 0.233 | 0.000 | ||
| 11 spectra, NMIFACQDNYRPVR | 0.000 | 0.151 | 0.042 | 0.000 | 0.101 | 0.668 | 0.038 | 0.000 | ||
| 1 spectrum, ILSTFK | 0.000 | 0.156 | 0.000 | 0.000 | 0.099 | 0.688 | 0.056 | 0.000 |
| Plot | Mito | Lyso or Perox | ER | Golgi | PM | Cytosol | Nucleus | ||||||
| Expt B |
4 peptides |
4 spectra |
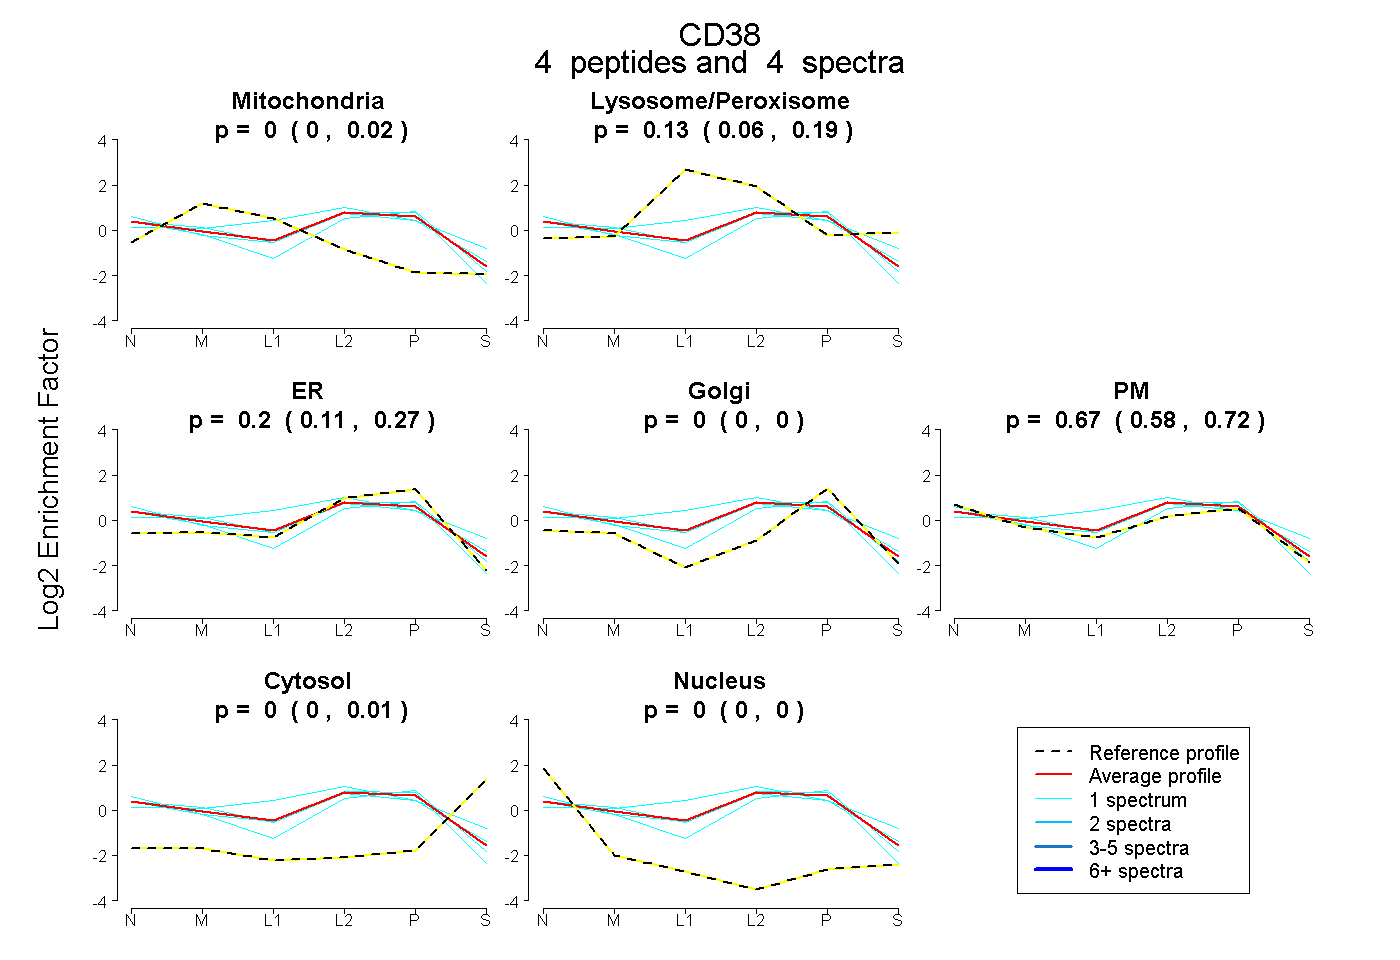 |
0.000 0.000 | 0.024 |
0.133 0.064 | 0.192 |
0.197 0.114 | 0.270 |
0.000 0.000 | 0.000 |
0.670 0.585 | 0.719 |
0.000 0.000 | 0.013 |
0.000 0.000 | 0.000 |
|||
| Plot | Lyso | Other | |||||||||||
| Expt C |
9 peptides |
31 spectra |
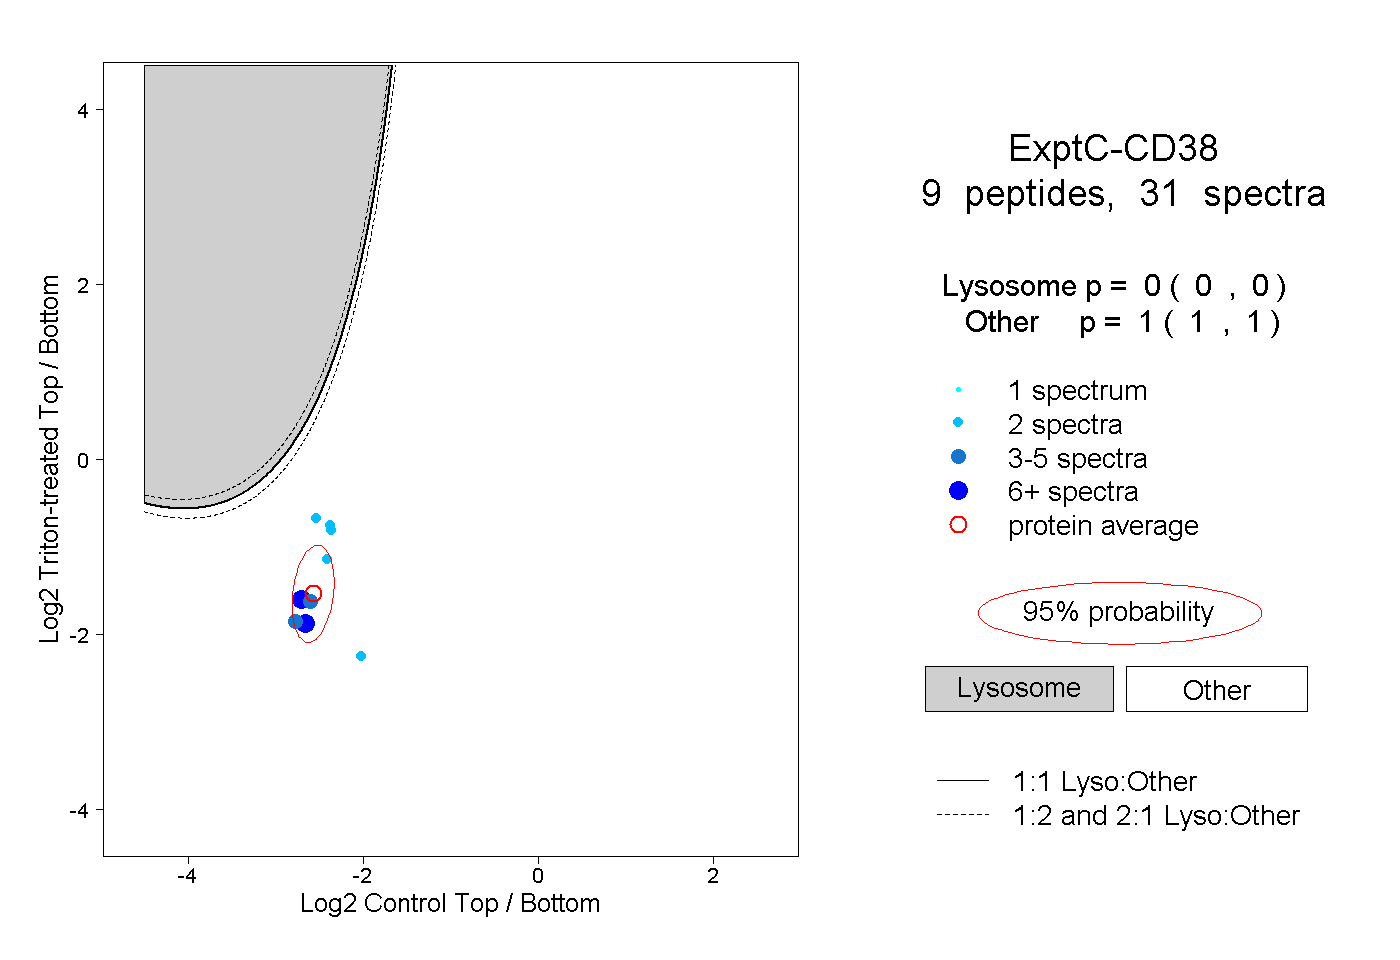 |
0.000 0.000 | 0.000 |
1.000 1.000 | 1.000 |
||||||||
| Plot | Lyso | Other | |||||||||||
| Expt D |
2 peptides |
3 spectra |
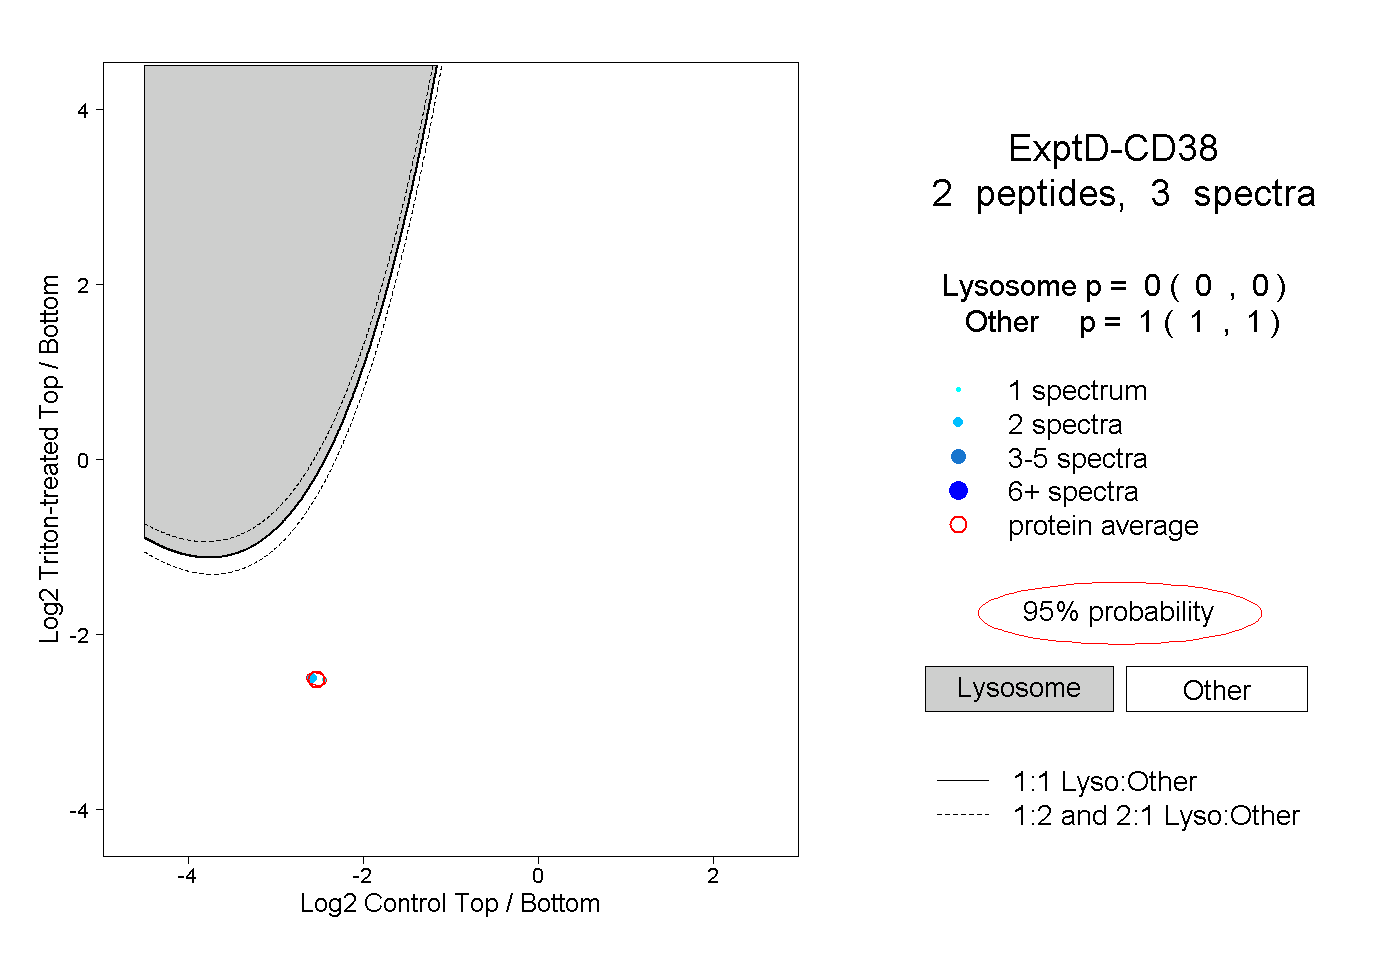 |
0.000 0.000 | 0.000 |
1.000 1.000 | 1.000 |