 4
4peptides
spectra
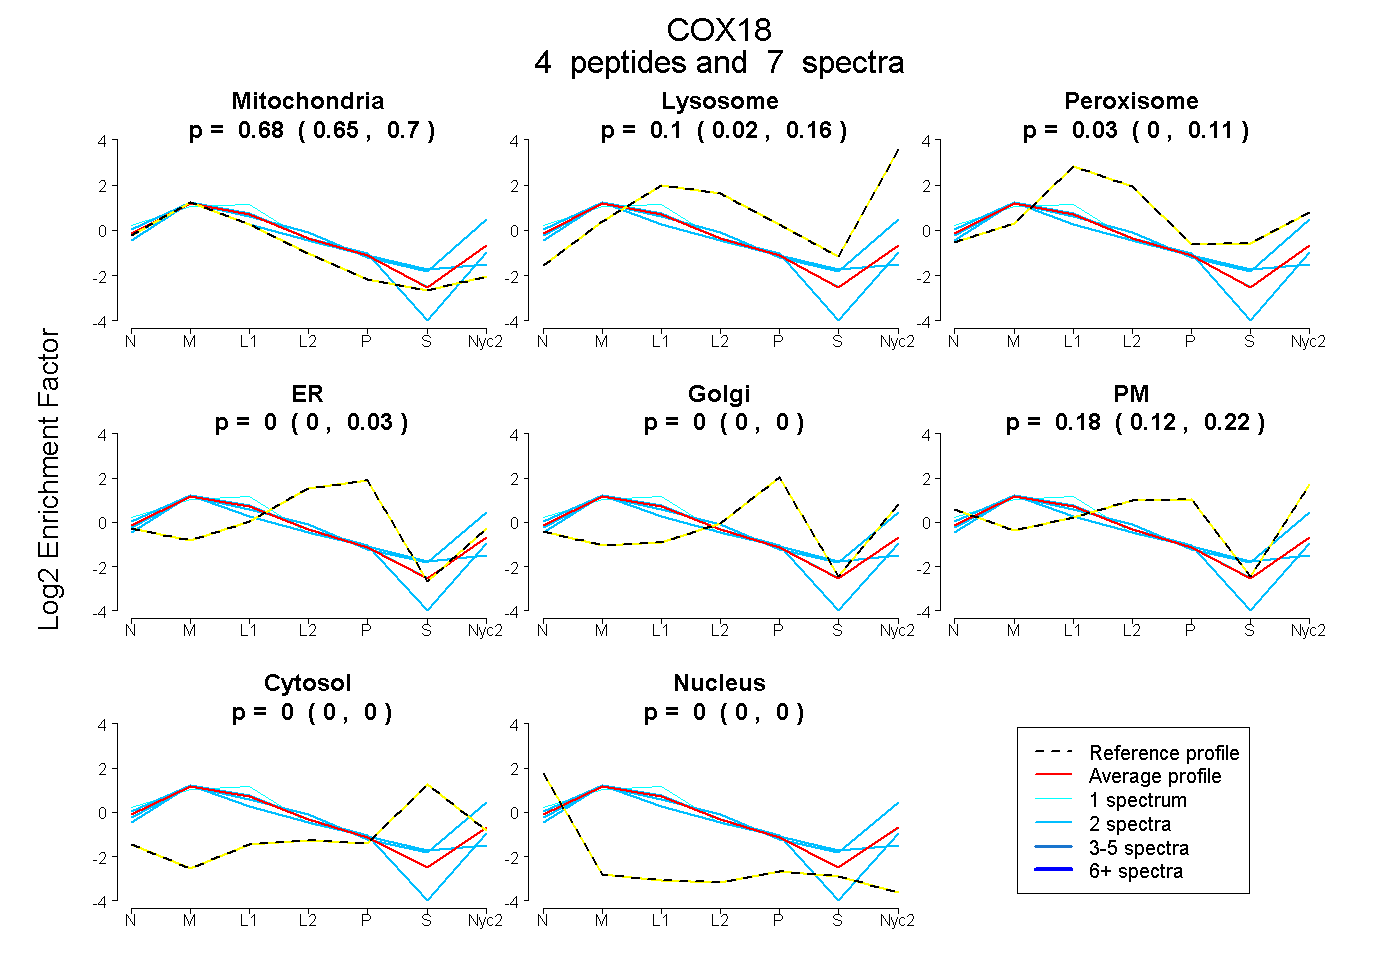
0.650 | 0.704
0.023 | 0.156
0.000 | 0.107
0.000 | 0.029
0.000 | 0.000
0.118 | 0.216
0.000 | 0.000
0.000 | 0.000
5peptides
spectra
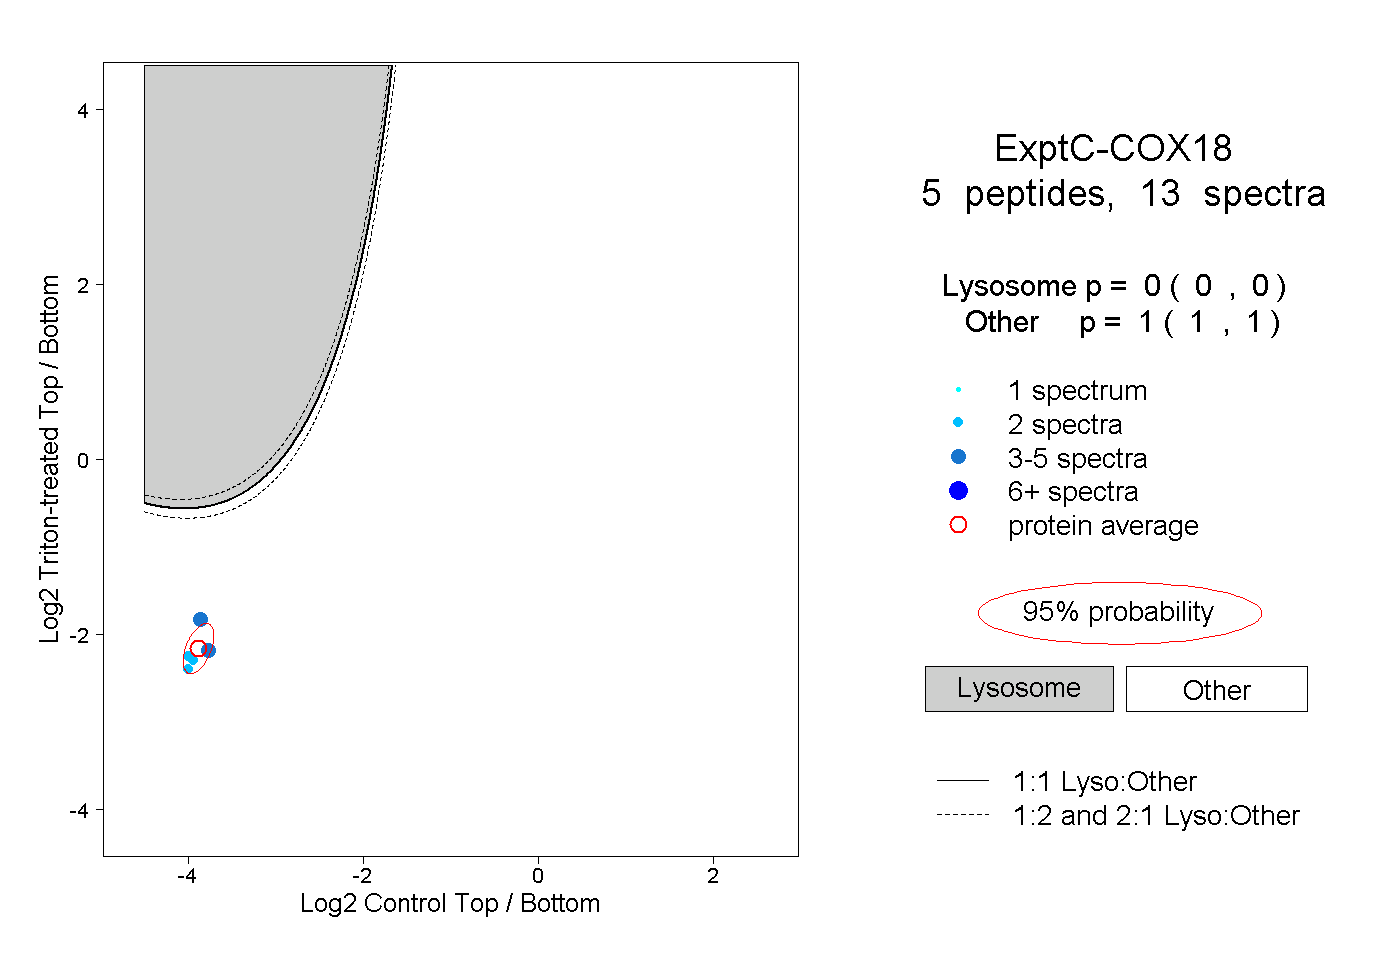
0.000 | 0.000
1.000 | 1.000
1peptide
spectra
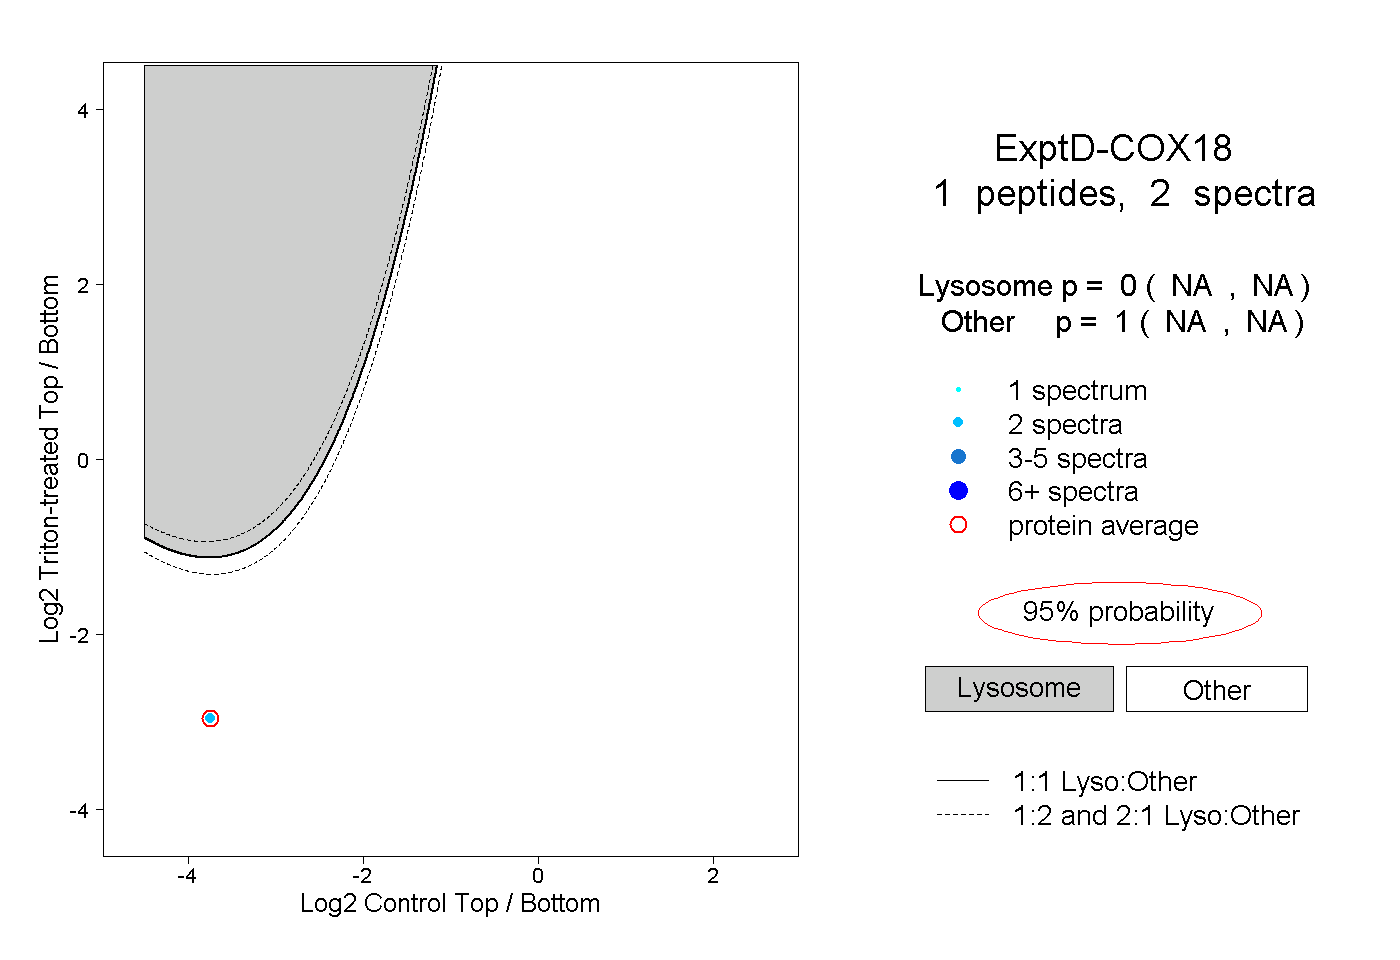
NA | NA
NA | NA