 4
4peptides
spectra
0.650 | 0.704
0.023 | 0.156
0.000 | 0.107
0.000 | 0.029
0.000 | 0.000
0.118 | 0.216
0.000 | 0.000
0.000 | 0.000
| Plot | Mito | Lyso | Perox | ER | Golgi | PM | Cytosol | Nucleus | |||||
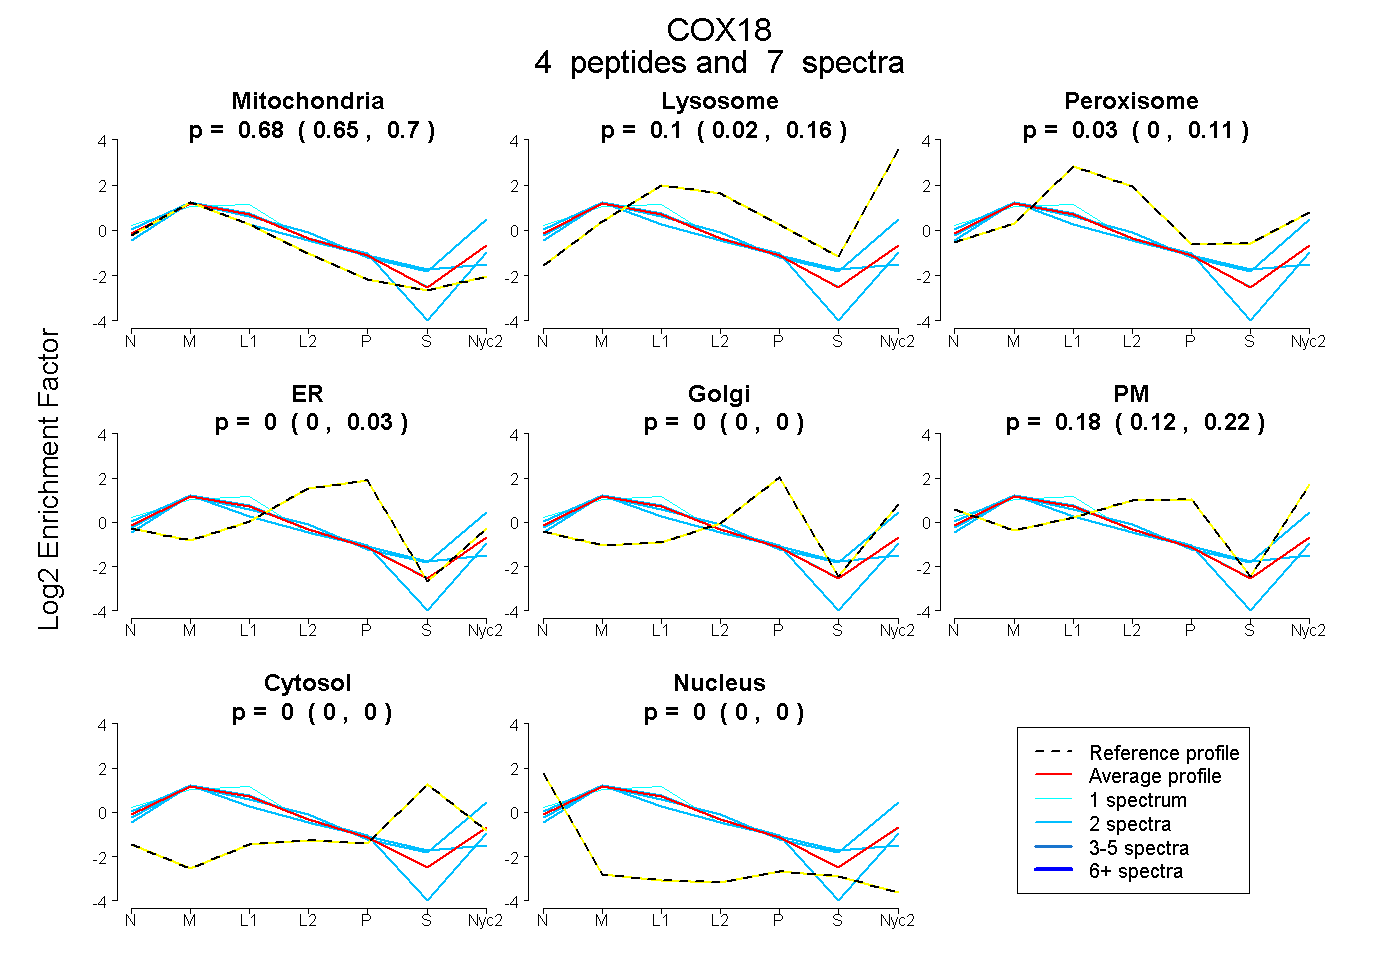
| Expt A |
4 peptides |
7 spectra |
|
0.682 0.650 | 0.704 |
0.104 0.023 | 0.156 |
0.033 0.000 | 0.107 |
0.000 0.000 | 0.029 |
0.000 0.000 | 0.000 |
0.181 0.118 | 0.216 |
0.000 0.000 | 0.000 |
0.000 0.000 | 0.000 |
| 2 spectra, QFGWSK | 0.700 | 0.000 | 0.131 | 0.059 | 0.057 | 0.000 | 0.054 | 0.000 | ||
| 2 spectra, SDSETPYR | 0.712 | 0.000 | 0.000 | 0.040 | 0.000 | 0.247 | 0.000 | 0.000 | ||
| 2 spectra, LNQEVAVCAR | 0.571 | 0.340 | 0.000 | 0.000 | 0.000 | 0.088 | 0.001 | 0.000 | ||
| 1 spectrum, FQMYVTNFVR | 0.634 | 0.000 | 0.159 | 0.000 | 0.000 | 0.207 | 0.000 | 0.000 |
| Plot | Lyso | Other | |||||||||||
| Expt C |
5 peptides |
13 spectra |
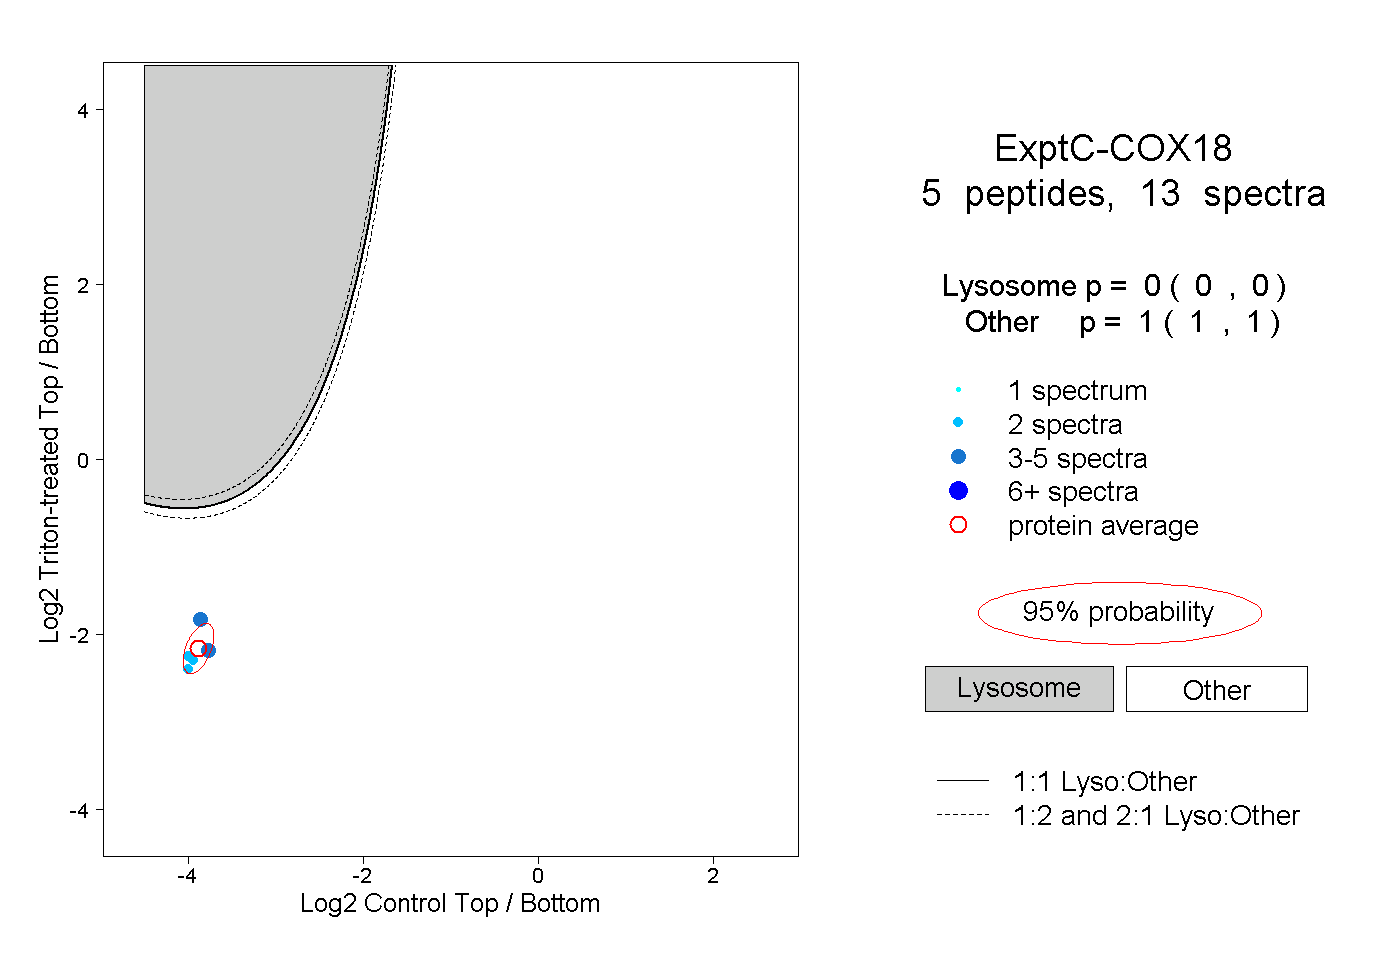 |
0.000 0.000 | 0.000 |
1.000 1.000 | 1.000 |
||||||||
| Plot | Lyso | Other | |||||||||||
| Expt D |
1 peptide |
2 spectra |
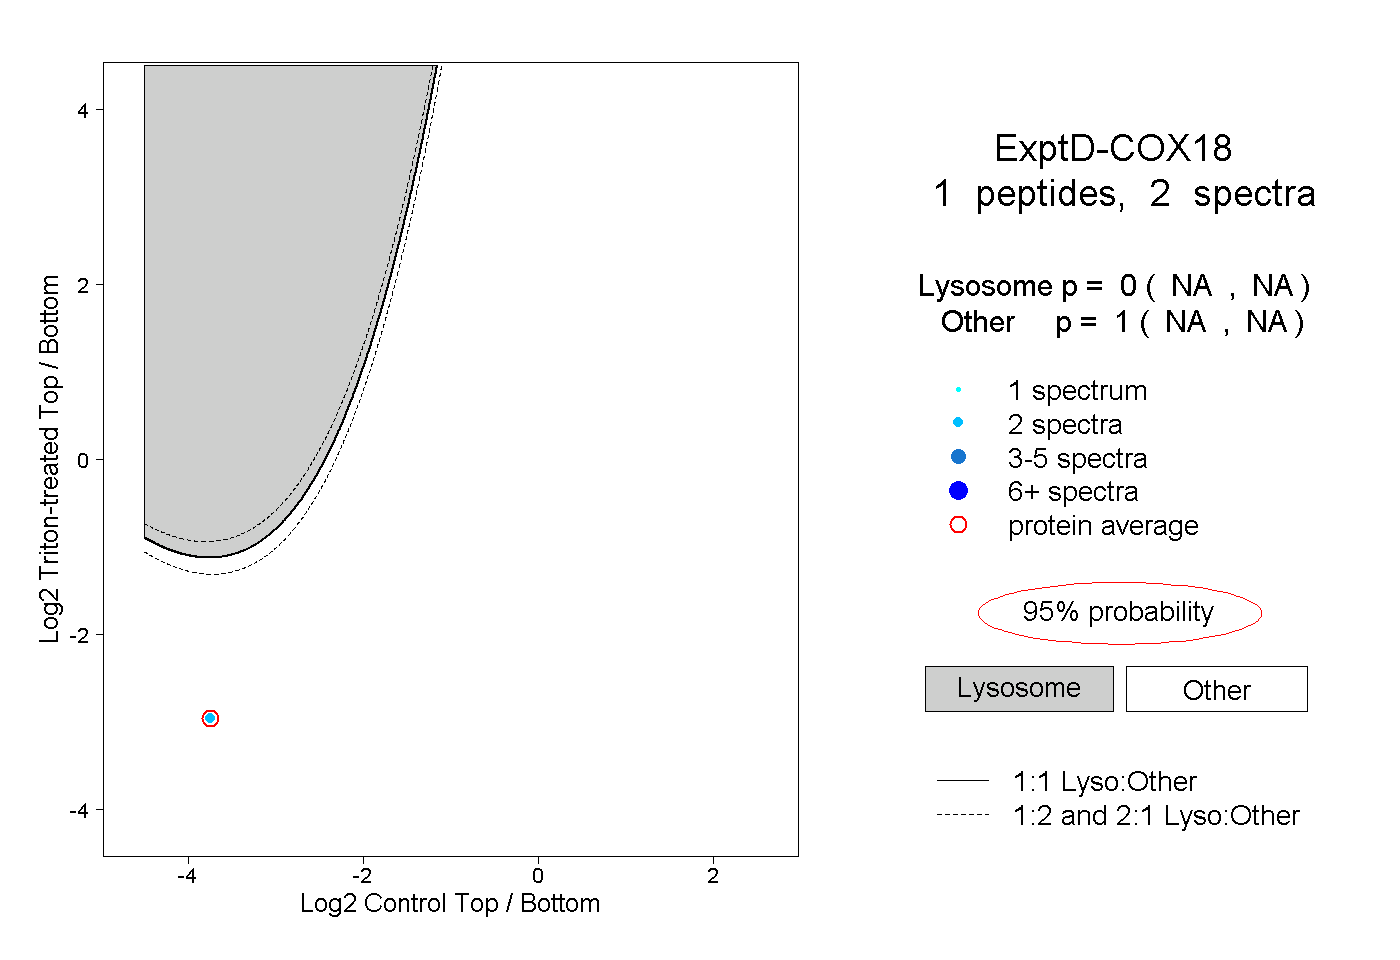 |
0.000 NA | NA |
1.000 NA | NA |