 5
5peptides
spectra
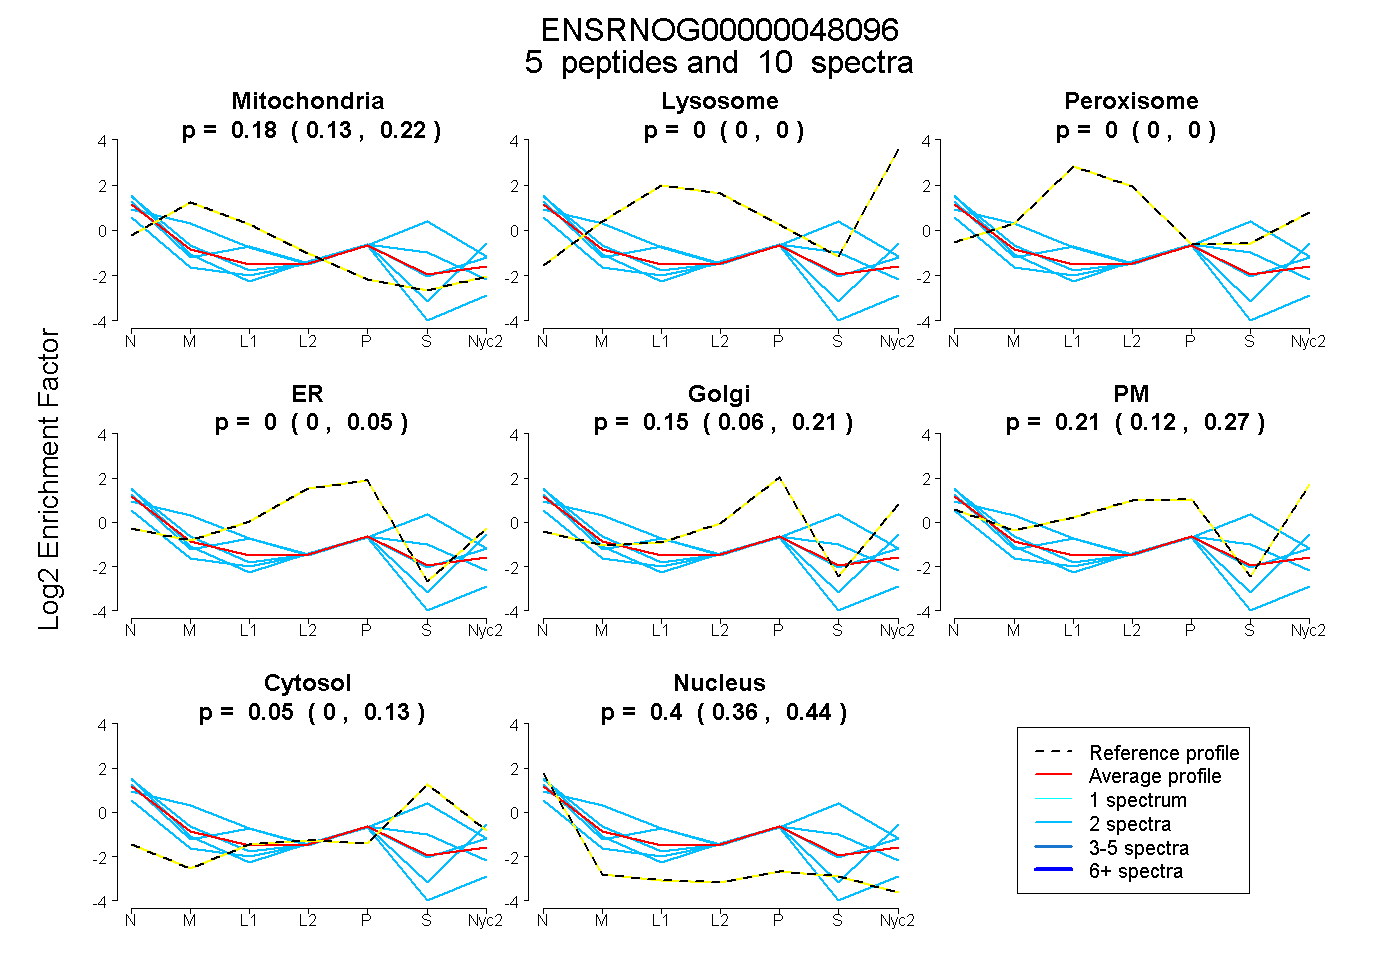
0.127 | 0.219
0.000 | 0.000
0.000 | 0.000
0.000 | 0.051
0.062 | 0.206
0.124 | 0.275
0.000 | 0.128
0.361 | 0.439
2peptides
spectra
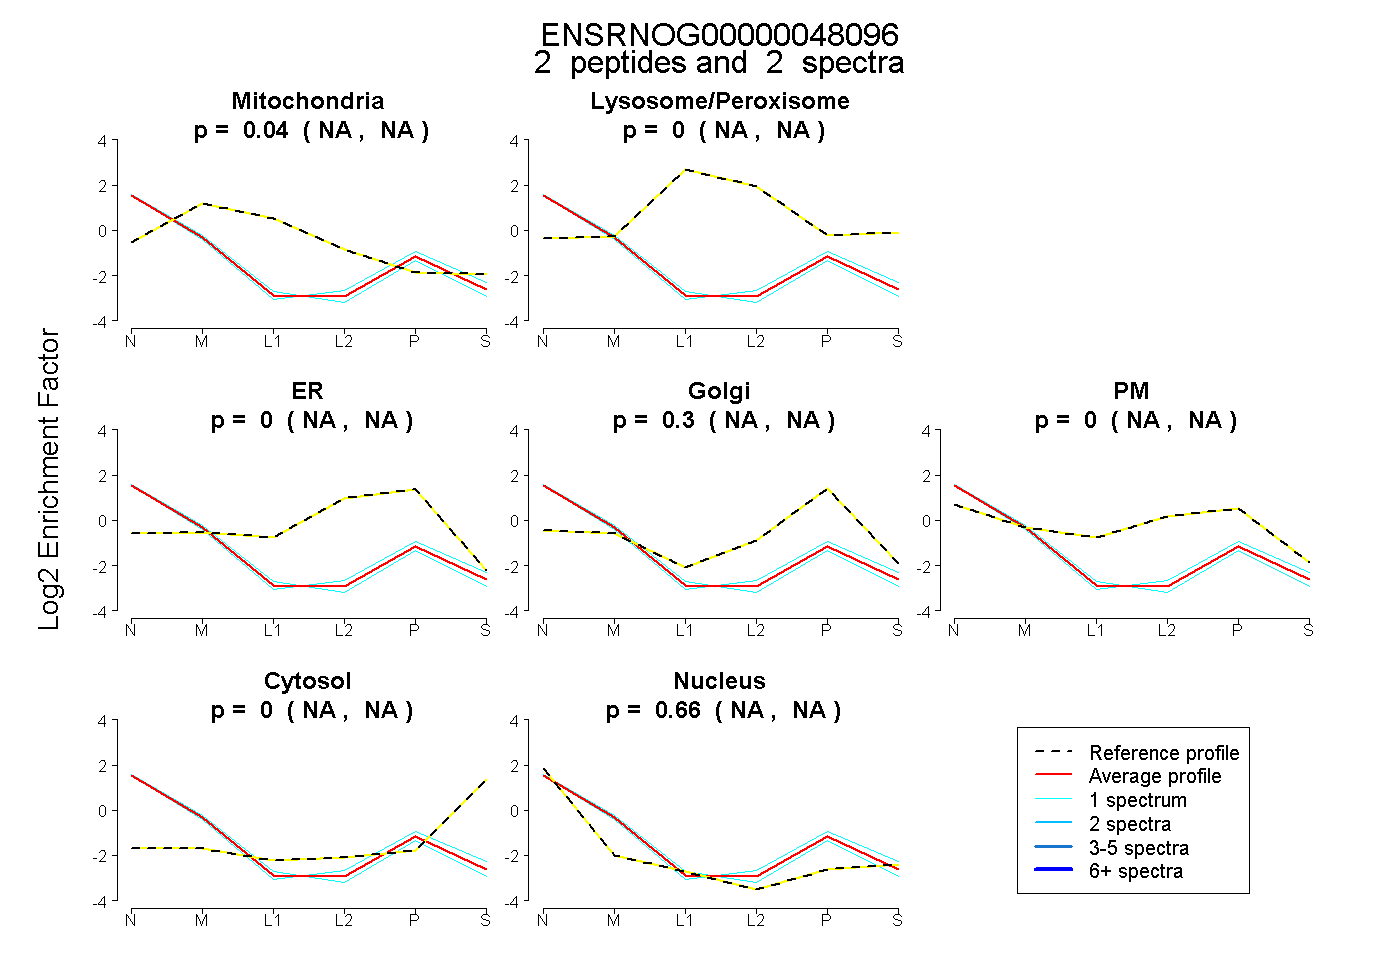
NA | NA
NA | NA
NA | NA
NA | NA
NA | NA
NA | NA
NA | NA
3peptides
spectra

0.000 | 1.000
0.000 | 1.000