 5
5peptides
spectra
0.127 | 0.219
0.000 | 0.000
0.000 | 0.000
0.000 | 0.051
0.062 | 0.206
0.124 | 0.275
0.000 | 0.128
0.361 | 0.439
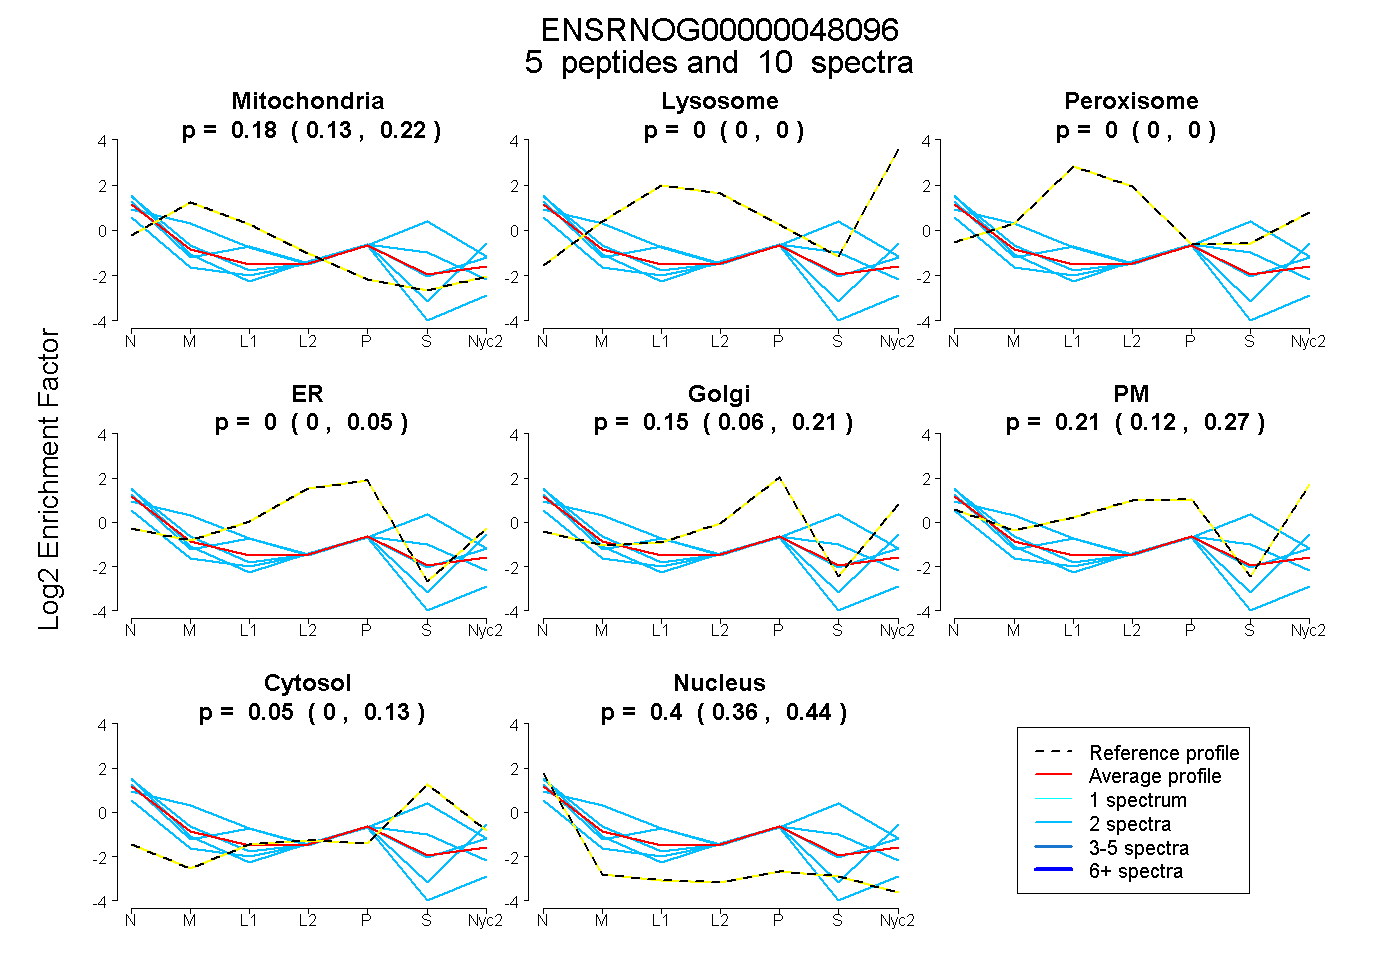
| Plot | Mito | Lyso | Perox | ER | Golgi | PM | Cytosol | Nucleus | |||||
| Expt A |
5 peptides |
10 spectra |
|
0.179 0.127 | 0.219 |
0.000 0.000 | 0.000 |
0.000 0.000 | 0.000 |
0.000 0.000 | 0.051 |
0.153 0.062 | 0.206 |
0.209 0.124 | 0.275 |
0.055 0.000 | 0.128 |
0.404 0.361 | 0.439 |
| 2 spectra, VAAVQPSDNISR | 0.000 | 0.000 | 0.000 | 0.000 | 0.051 | 0.446 | 0.000 | 0.503 | ||
| 2 spectra, IYSPVR | 0.444 | 0.000 | 0.000 | 0.000 | 0.158 | 0.185 | 0.000 | 0.212 | ||
| 2 spectra, WFVLVDR | 0.204 | 0.000 | 0.000 | 0.276 | 0.000 | 0.000 | 0.000 | 0.520 | ||
| 2 spectra, AGWLFK | 0.000 | 0.000 | 0.000 | 0.000 | 0.032 | 0.157 | 0.576 | 0.234 | ||
| 2 spectra, SPSQGSYSR | 0.001 | 0.000 | 0.266 | 0.105 | 0.022 | 0.000 | 0.115 | 0.491 |
| Plot | Mito | Lyso or Perox | ER | Golgi | PM | Cytosol | Nucleus | ||||||
| Expt B |
2 peptides |
2 spectra |
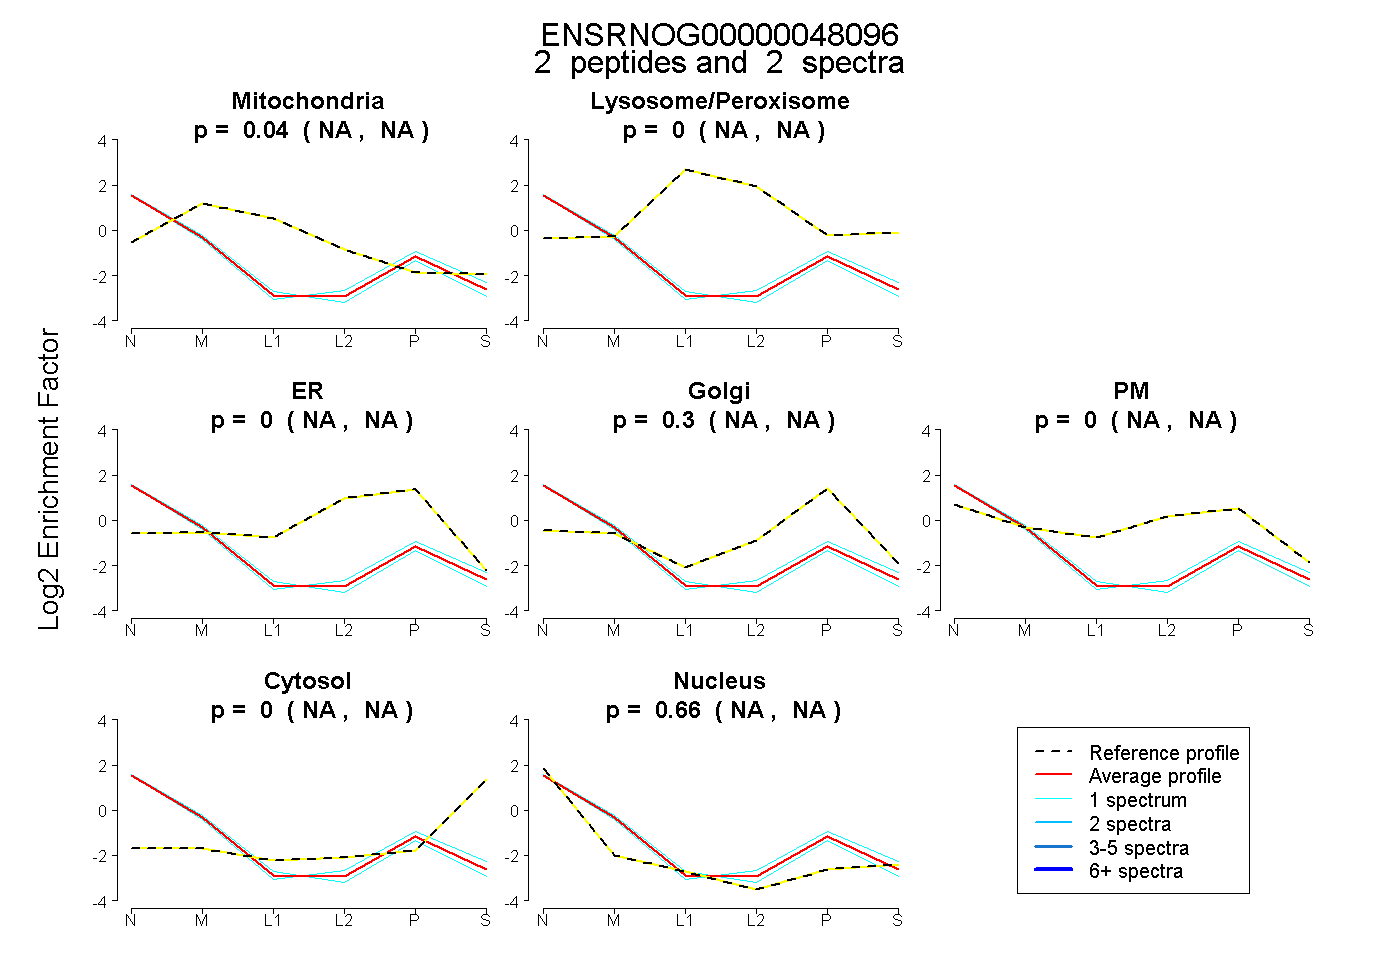 |
0.035 NA | NA |
0.000 NA | NA |
0.000 NA | NA |
0.304 NA | NA |
0.000 NA | NA |
0.000 NA | NA |
0.661 NA | NA |
|||
| Plot | Lyso | Other | |||||||||||
| Expt C |
3 peptides |
7 spectra |
 |
0.000 0.000 | 1.000 |
1.000 0.000 | 1.000 |