 7
7peptides
spectra
0.000 | 0.000
0.000 | 0.000
0.000 | 0.000
0.269 | 0.426
0.000 | 0.107
0.000 | 0.000
0.000 | 0.103
0.505 | 0.585
1peptide
spectrum
NA | NA
NA | NA
NA | NA
NA | NA
NA | NA
NA | NA
NA | NA
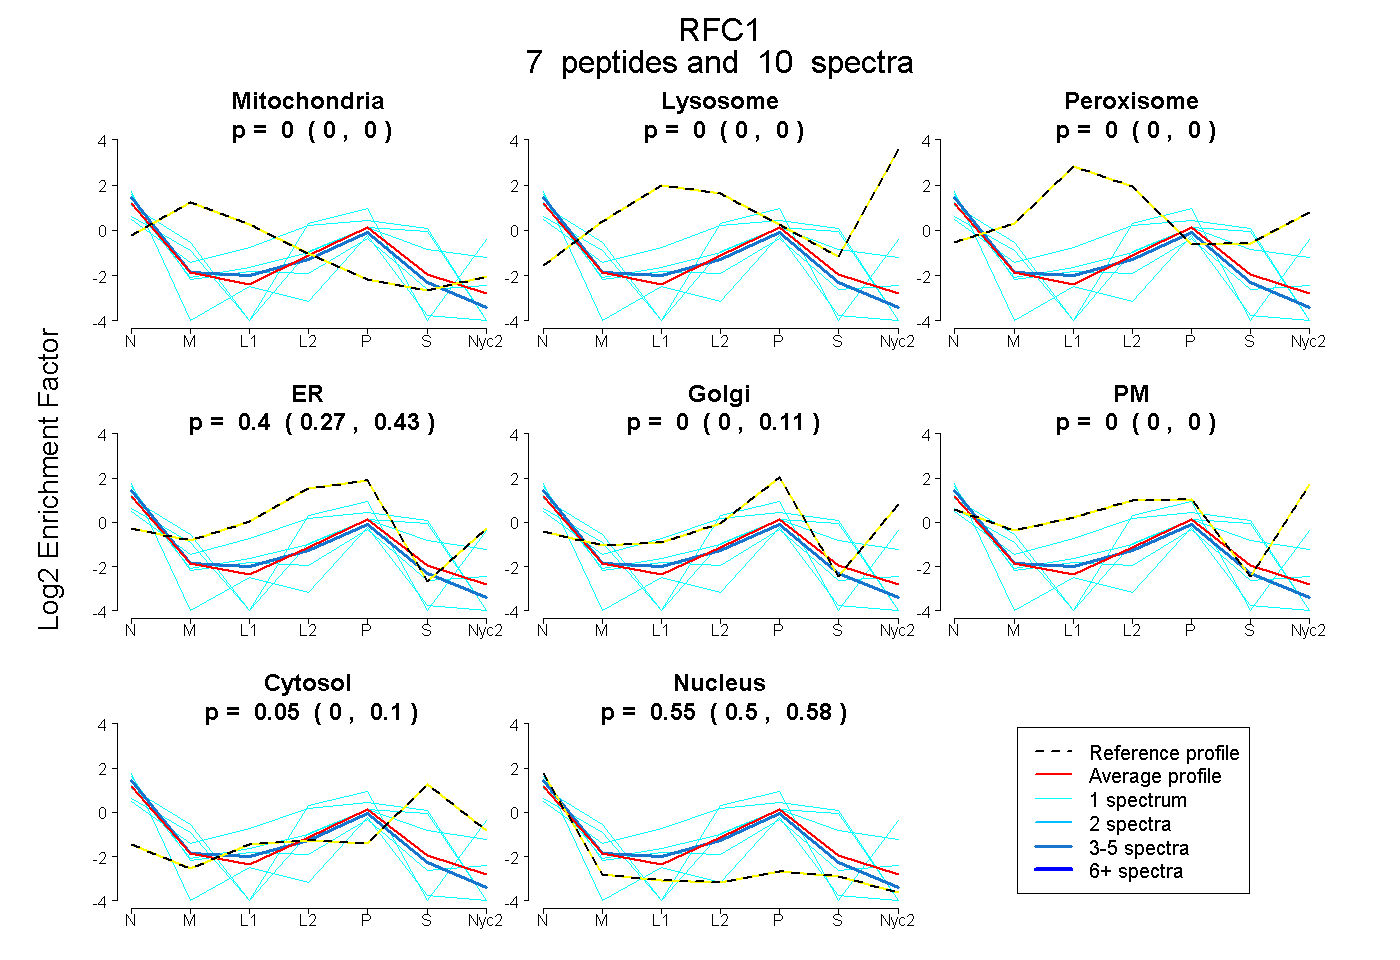
| Plot | Mito | Lyso | Perox | ER | Golgi | PM | Cytosol | Nucleus | |||||
| Expt A |
7 peptides |
10 spectra |
|
0.000 0.000 | 0.000 |
0.000 0.000 | 0.000 |
0.000 0.000 | 0.000 |
0.398 0.269 | 0.426 |
0.000 0.000 | 0.107 |
0.000 0.000 | 0.000 |
0.048 0.000 | 0.103 |
0.553 0.505 | 0.585 |
||
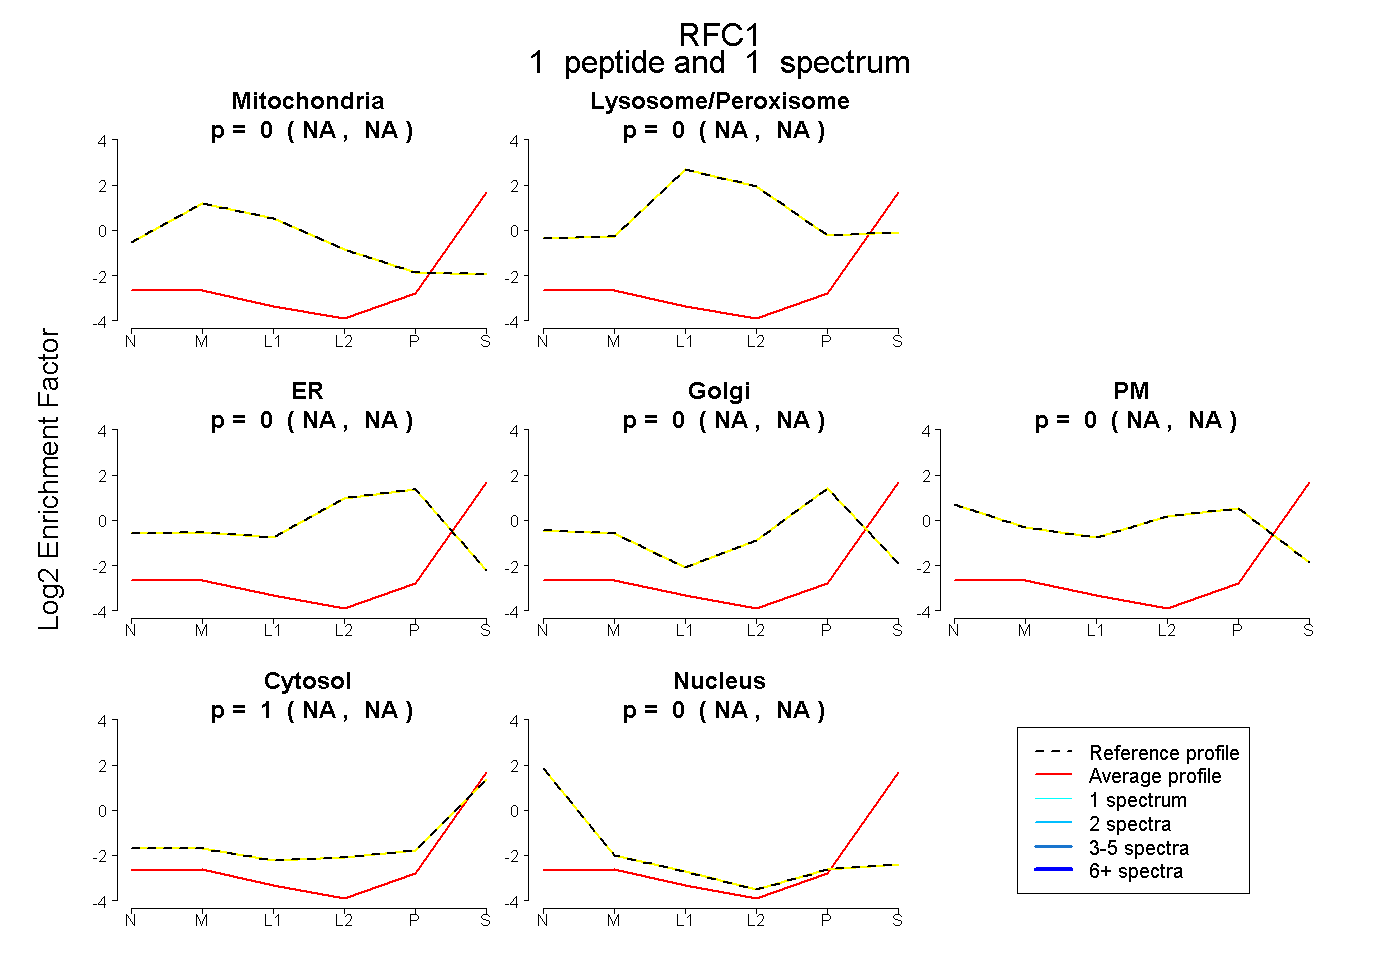
| Plot | Mito | Lyso or Perox | ER | Golgi | PM | Cytosol | Nucleus | ||||||
| Expt B |
1 peptide |
1 spectrum |
|
0.000 NA | NA |
0.000 NA | NA |
0.000 NA | NA |
0.000 NA | NA |
0.000 NA | NA |
1.000 NA | NA |
0.000 NA | NA |