 4
4peptides
spectra
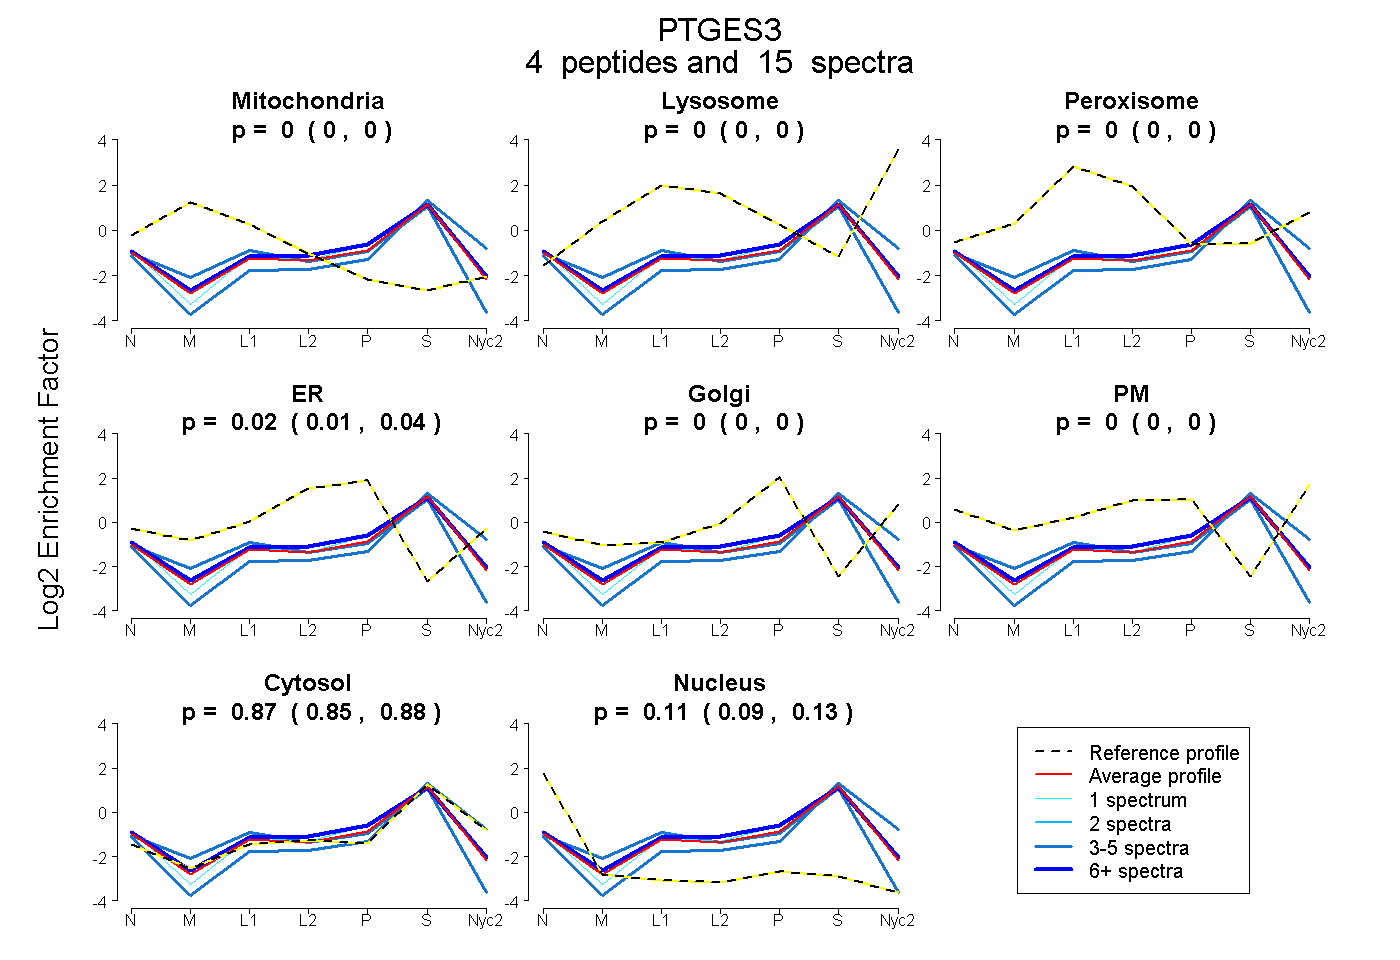
0.000 | 0.000
0.000 | 0.000
0.000 | 0.000
0.007 | 0.035
0.000 | 0.000
0.000 | 0.000
0.853 | 0.882
0.087 | 0.127
3peptides
spectra
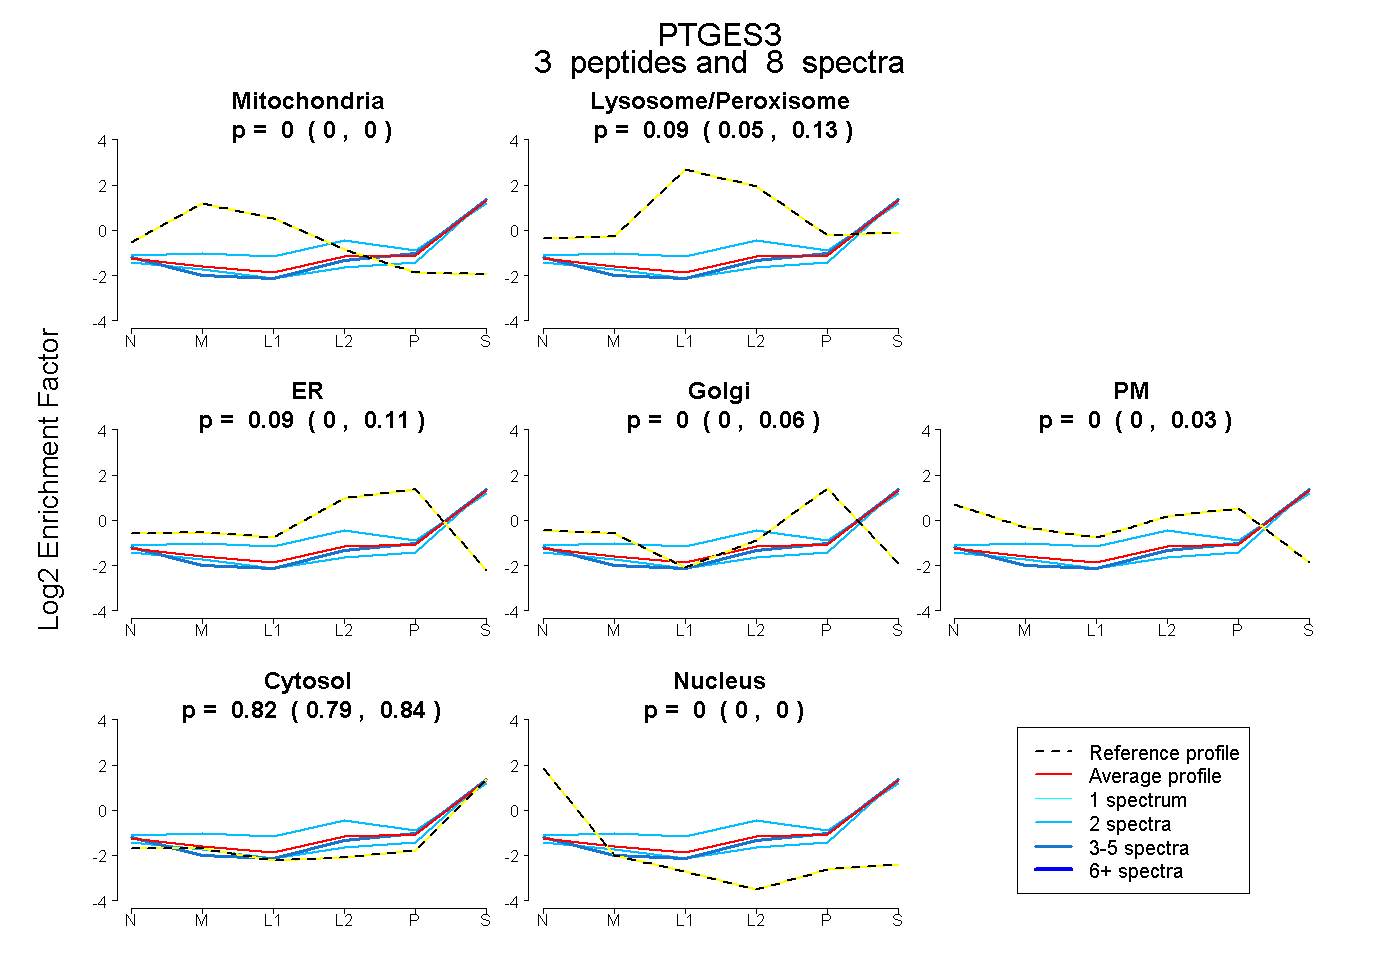
0.000 | 0.000
0.052 | 0.127
0.000 | 0.113
0.000 | 0.064
0.000 | 0.030
0.791 | 0.838
0.000 | 0.000
5peptides
spectra
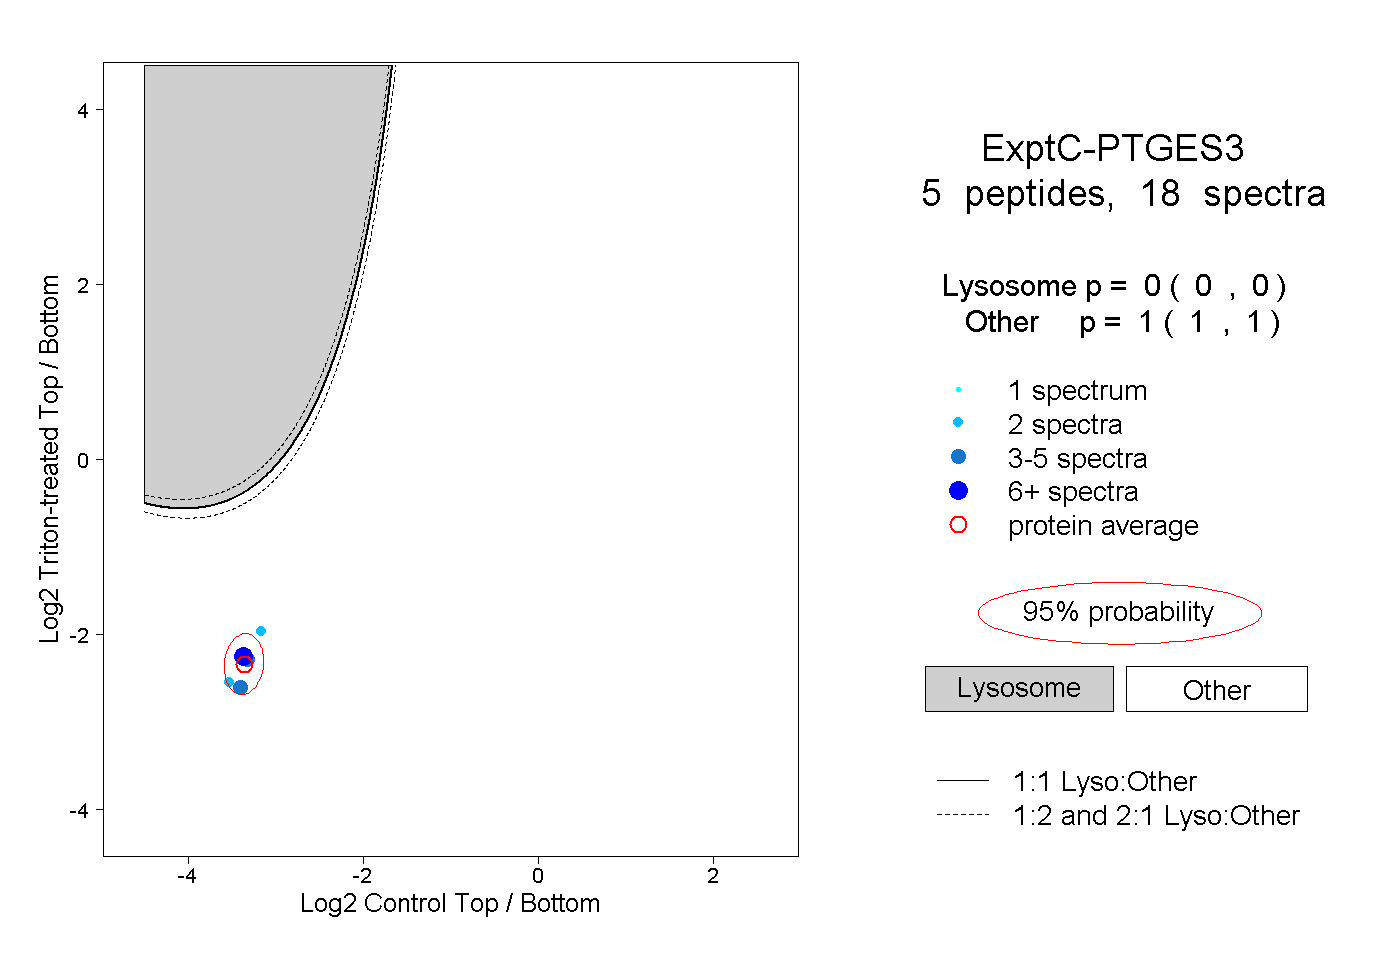
0.000 | 0.000
1.000 | 1.000
1peptide
spectrum
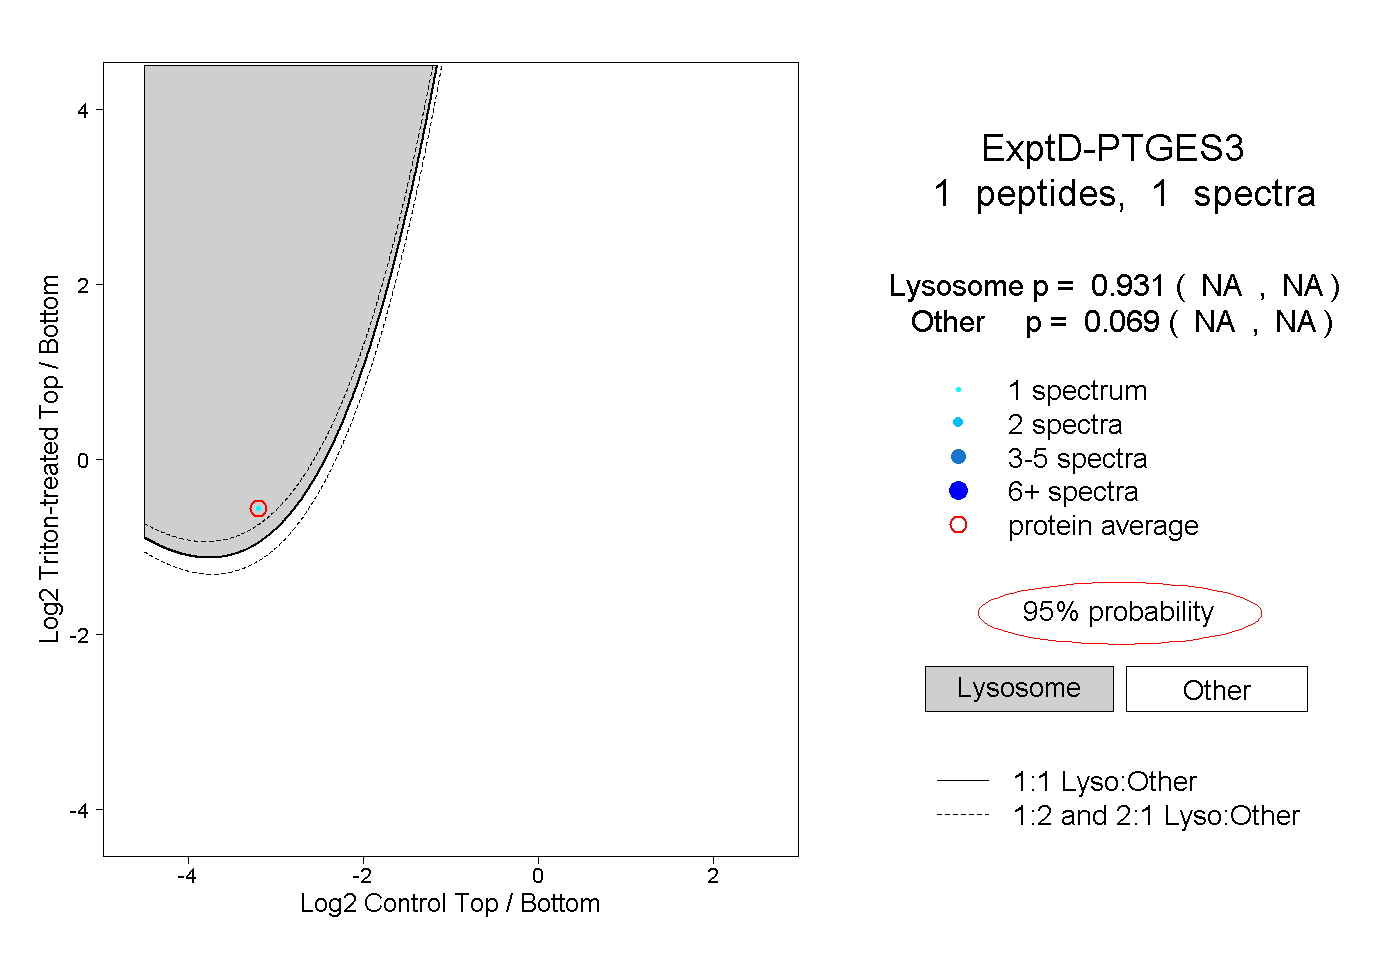
NA | NA
NA | NA