 4
4peptides
spectra
0.000 | 0.000
0.000 | 0.000
0.000 | 0.000
0.007 | 0.035
0.000 | 0.000
0.000 | 0.000
0.853 | 0.882
0.087 | 0.127
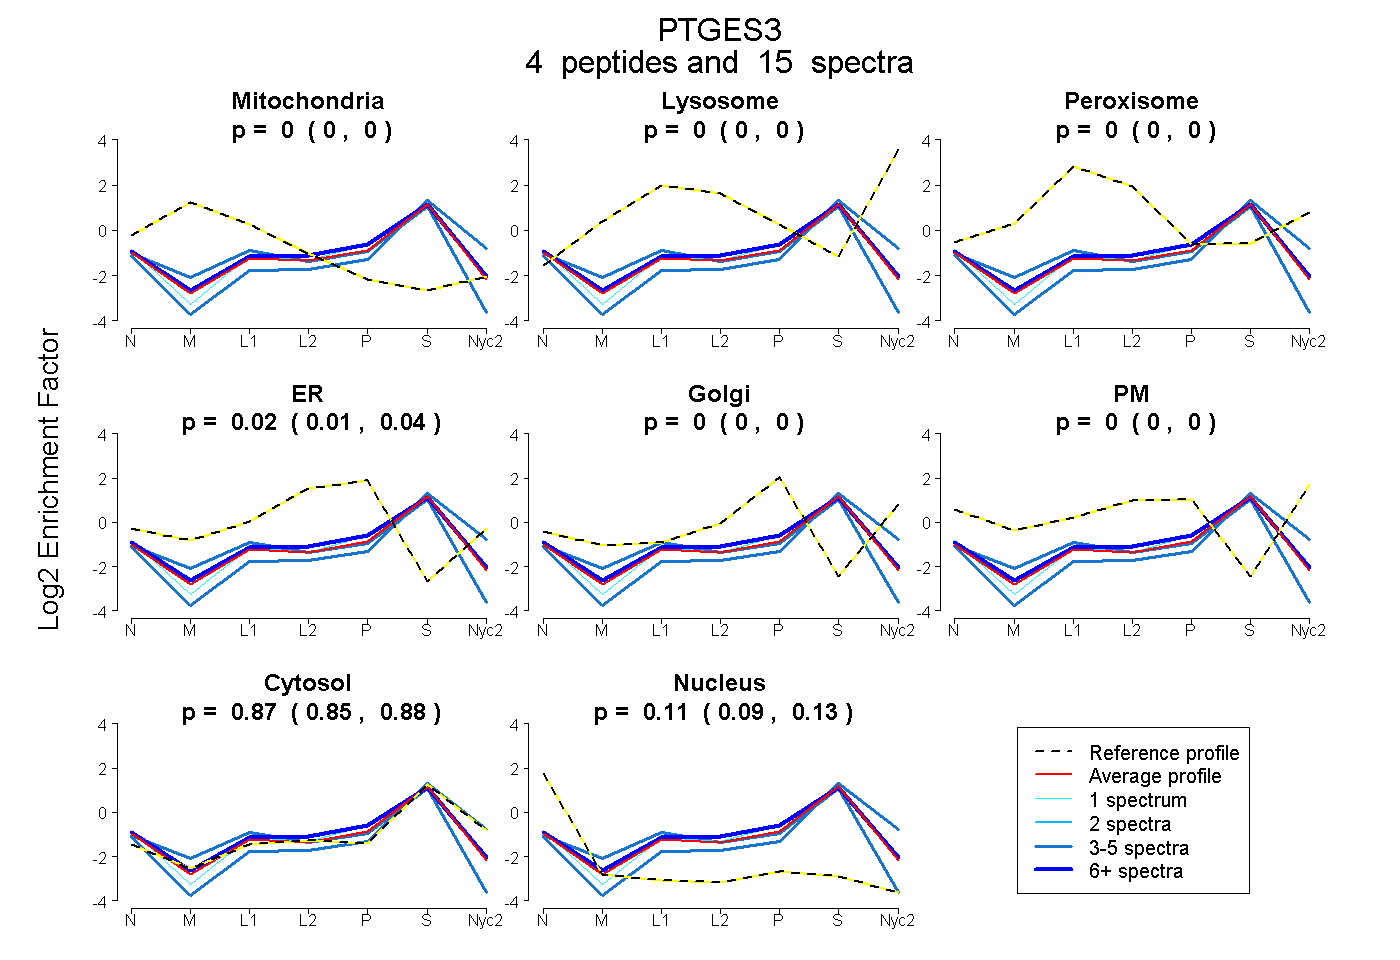
| Plot | Mito | Lyso | Perox | ER | Golgi | PM | Cytosol | Nucleus | |||||
| Expt A |
4 peptides |
15 spectra |
|
0.000 0.000 | 0.000 |
0.000 0.000 | 0.000 |
0.000 0.000 | 0.000 |
0.022 0.007 | 0.035 |
0.000 0.000 | 0.000 |
0.000 0.000 | 0.000 |
0.869 0.853 | 0.882 |
0.108 0.087 | 0.127 |
| 7 spectra, SILCCLR | 0.000 | 0.000 | 0.000 | 0.080 | 0.000 | 0.000 | 0.844 | 0.075 | ||
| 4 spectra, HLNEIDLFHCIDPNDSK | 0.109 | 0.000 | 0.000 | 0.000 | 0.000 | 0.000 | 0.744 | 0.146 | ||
| 3 spectra, DVNVNFEK | 0.000 | 0.000 | 0.000 | 0.000 | 0.000 | 0.000 | 0.948 | 0.052 | ||
| 1 spectrum, LTFSCLGGSDNFK | 0.000 | 0.000 | 0.000 | 0.029 | 0.000 | 0.000 | 0.863 | 0.108 |
| Plot | Mito | Lyso or Perox | ER | Golgi | PM | Cytosol | Nucleus | ||||||
| Expt B |
3 peptides |
8 spectra |
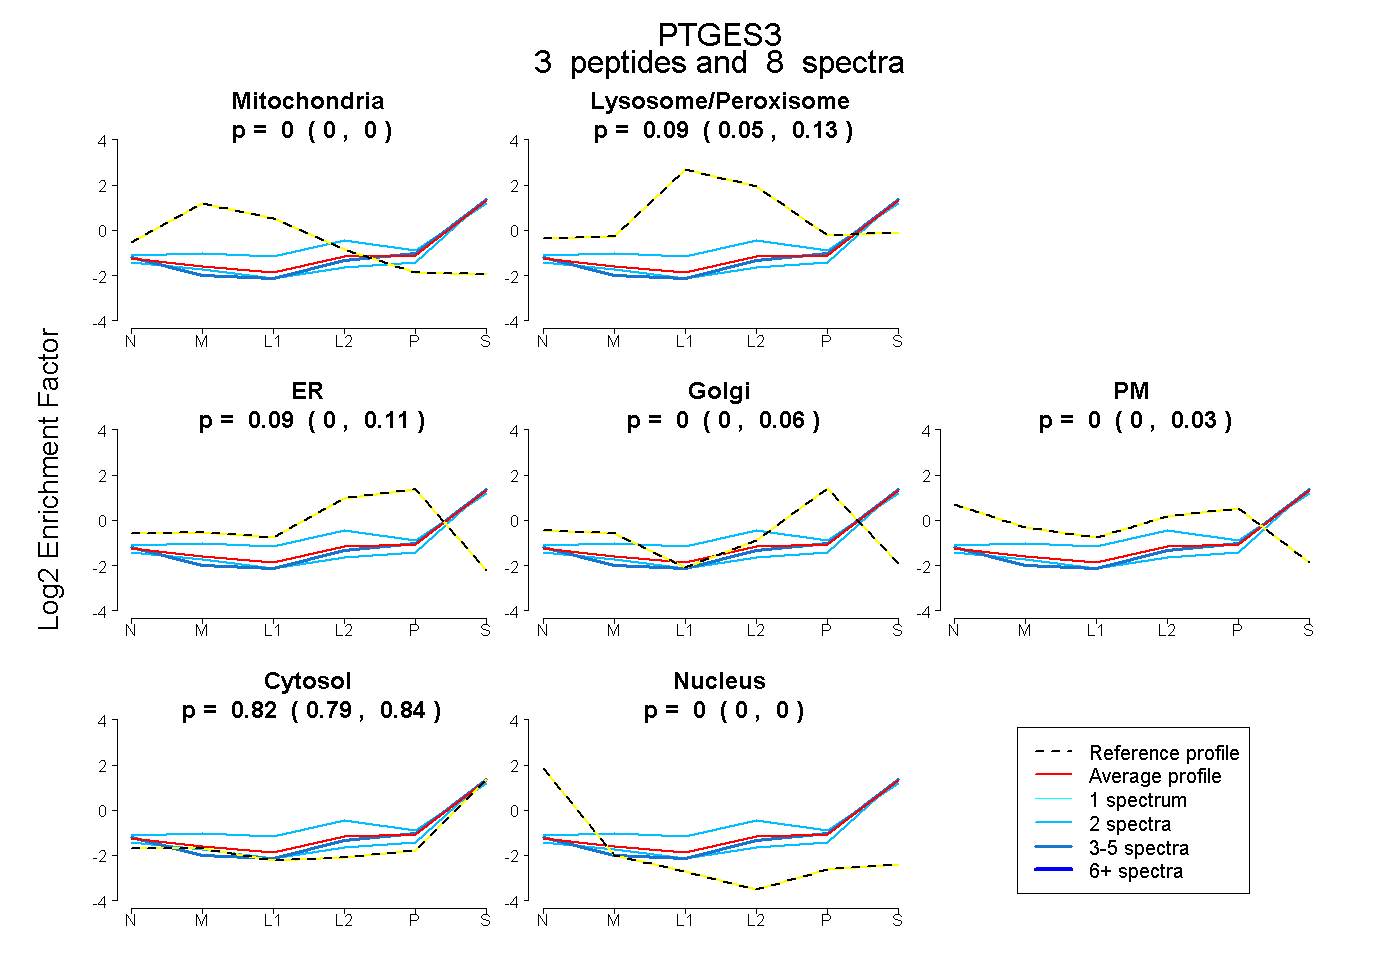 |
0.000 0.000 | 0.000 |
0.092 0.052 | 0.127 |
0.089 0.000 | 0.113 |
0.000 0.000 | 0.064 |
0.000 0.000 | 0.030 |
0.819 0.791 | 0.838 |
0.000 0.000 | 0.000 |
|||
| Plot | Lyso | Other | |||||||||||
| Expt C |
5 peptides |
18 spectra |
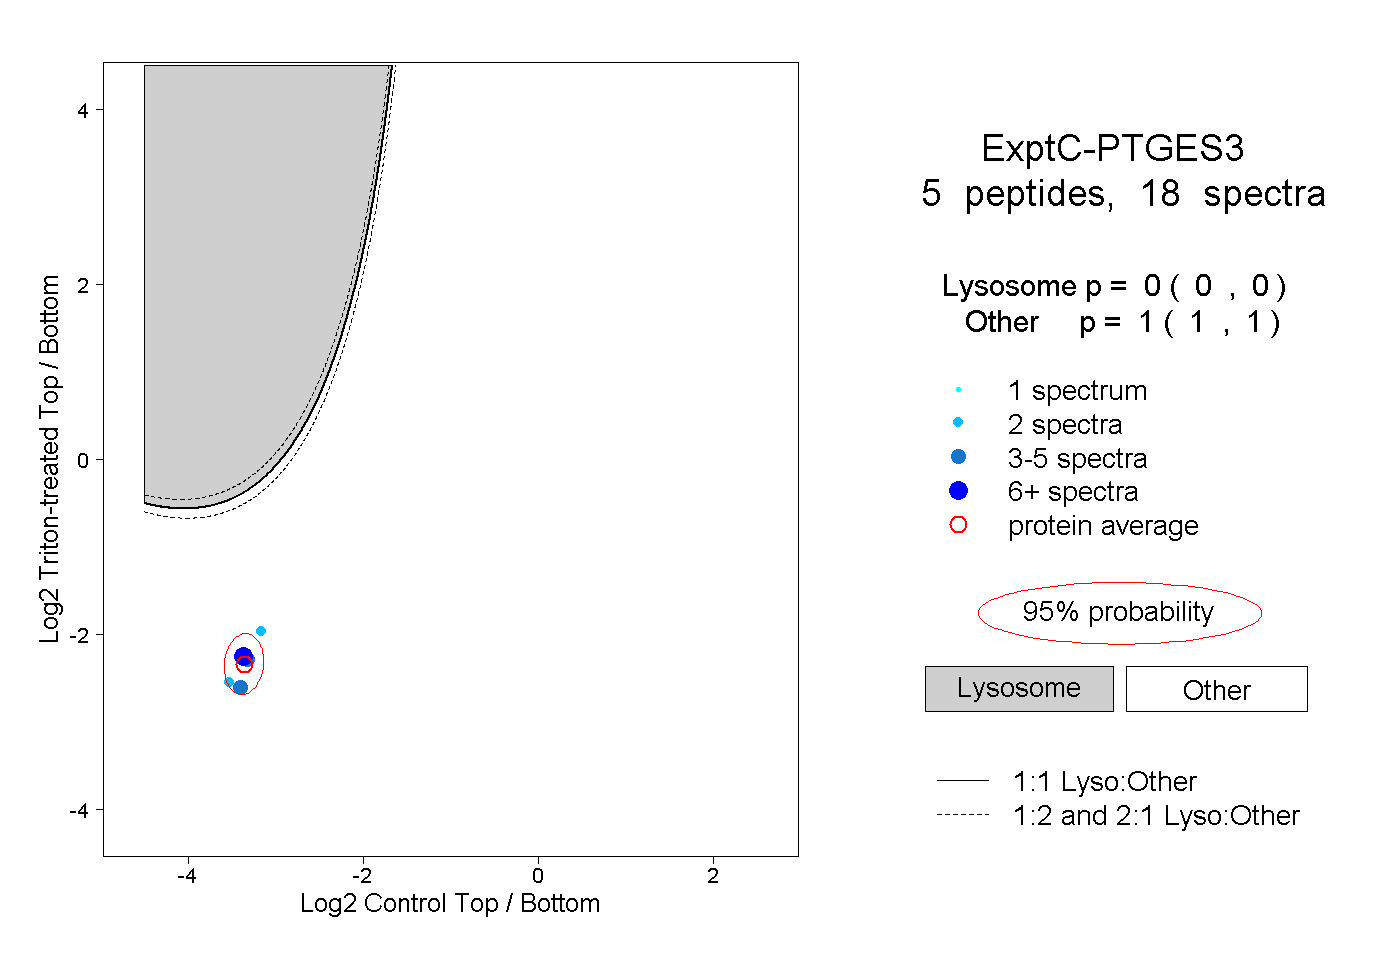 |
0.000 0.000 | 0.000 |
1.000 1.000 | 1.000 |
||||||||
| Plot | Lyso | Other | |||||||||||
| Expt D |
1 peptide |
1 spectrum |
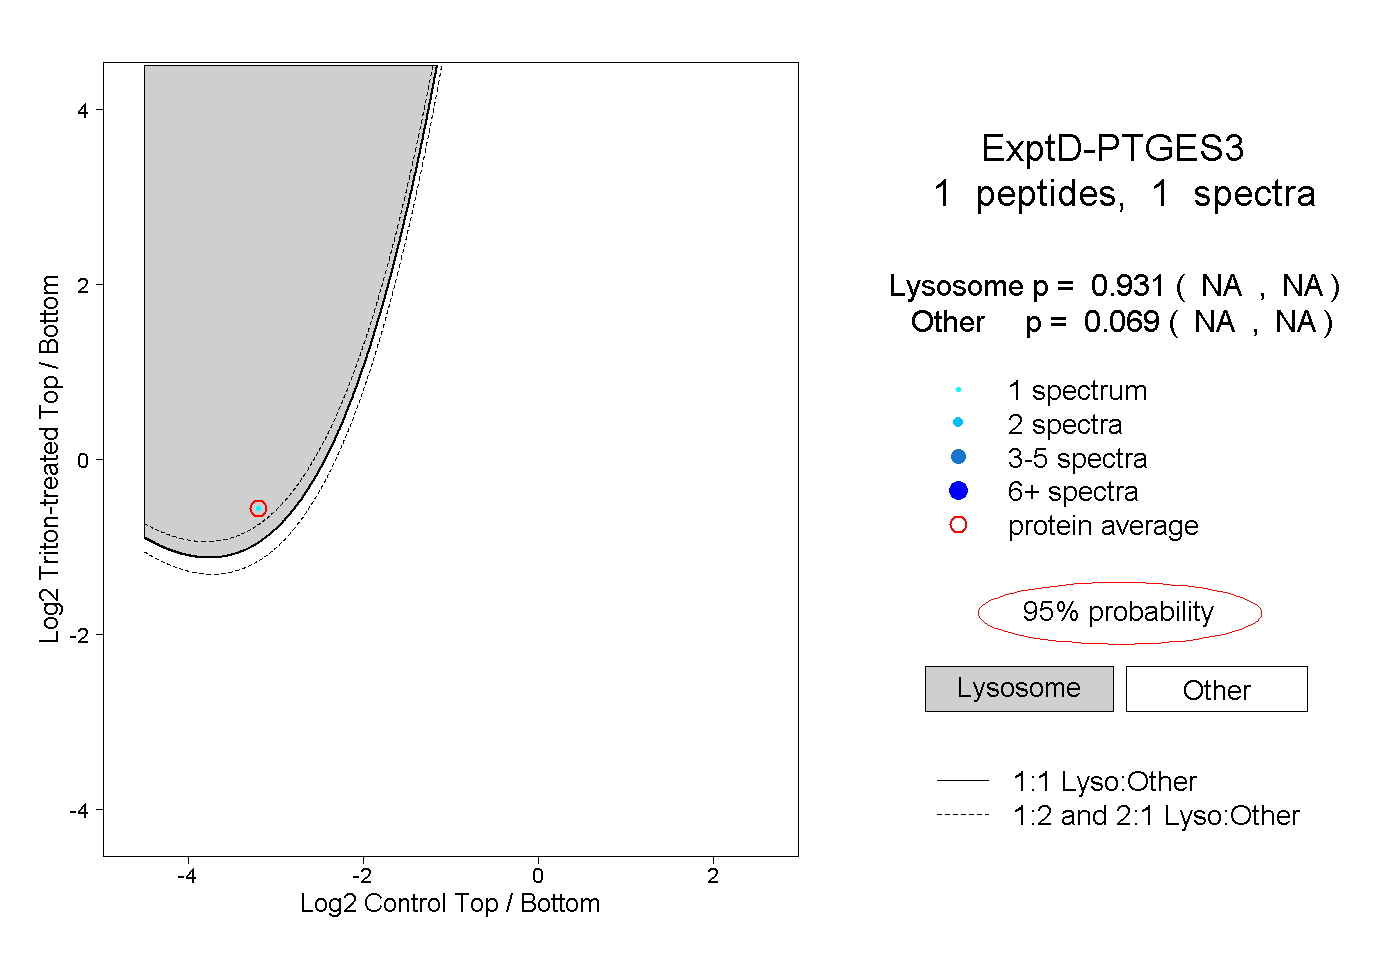 |
0.931 NA | NA |
0.069 NA | NA |