 15
15peptides
spectra
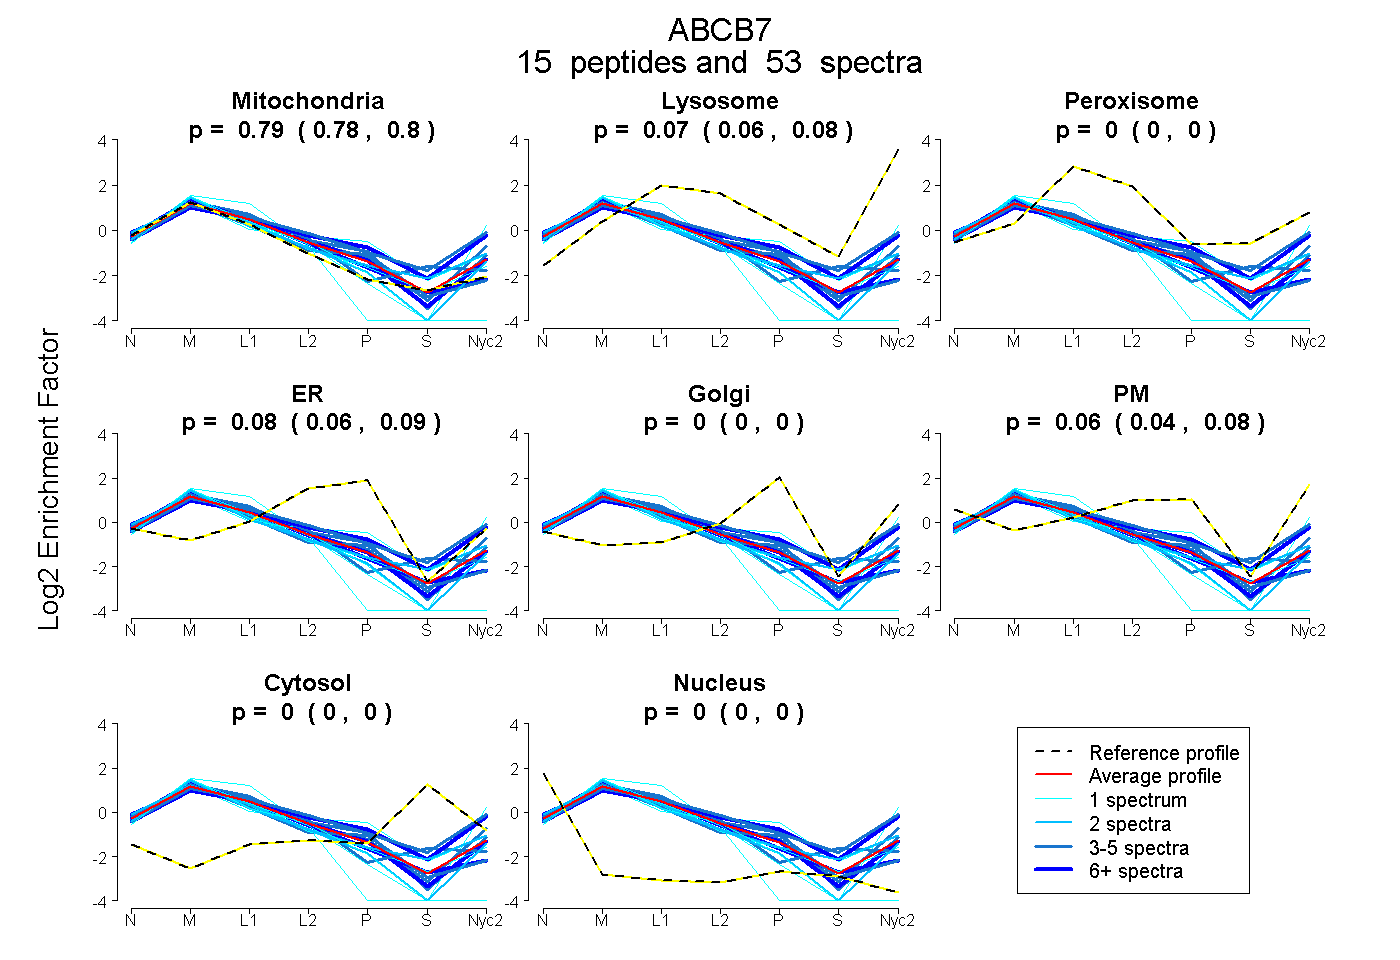
0.783 | 0.798
0.063 | 0.077
0.000 | 0.000
0.060 | 0.095
0.000 | 0.000
0.040 | 0.076
0.000 | 0.000
0.000 | 0.000
8peptides
spectra
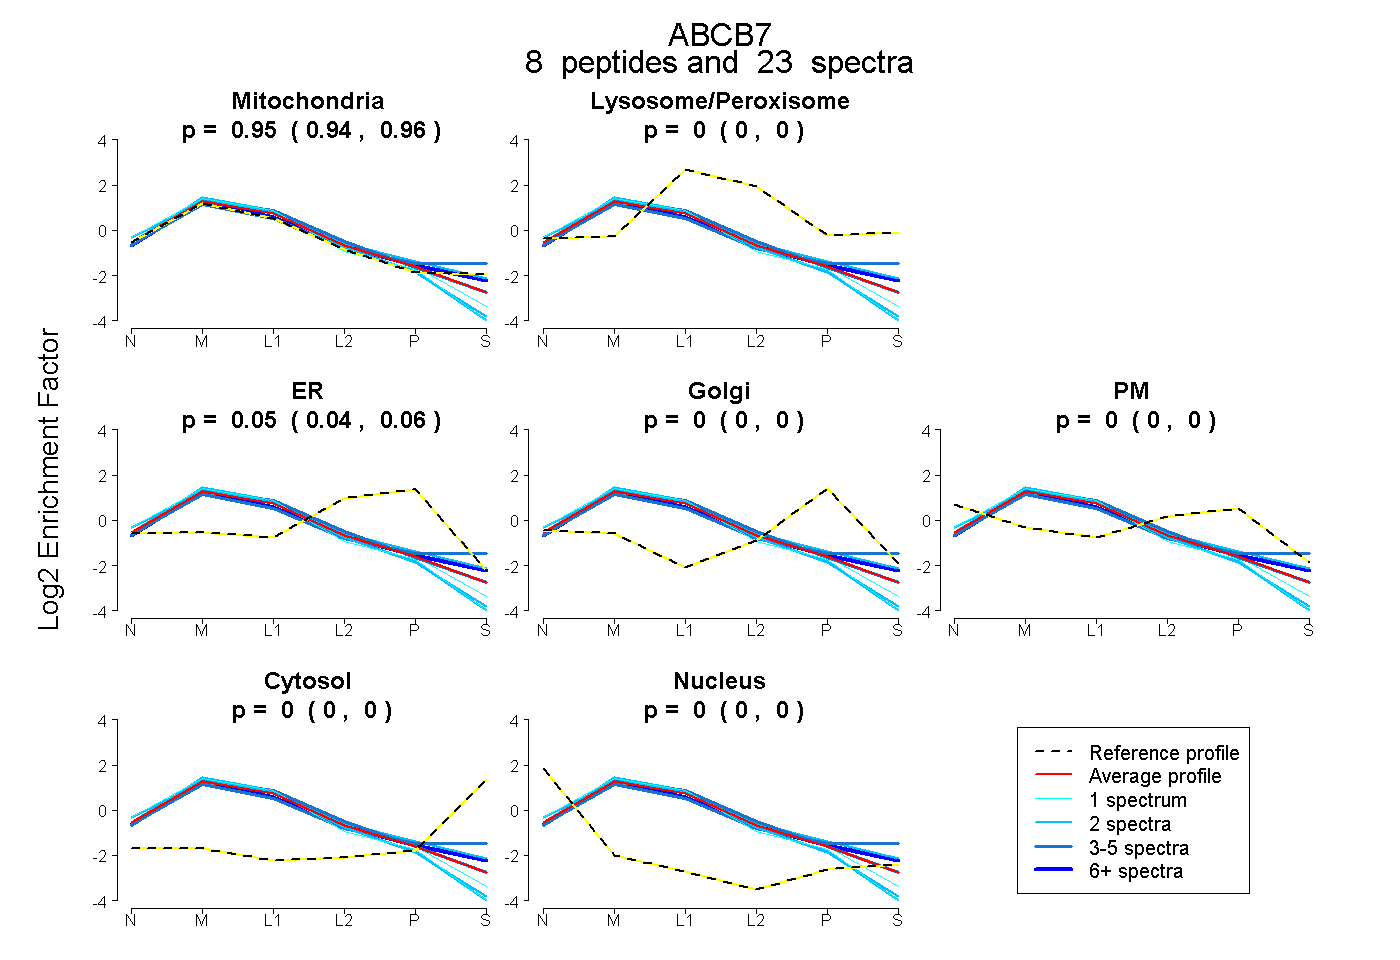
0.941 | 0.958
0.000 | 0.000
0.040 | 0.057
0.000 | 0.000
0.000 | 0.000
0.000 | 0.000
0.000 | 0.000
19peptides
spectra
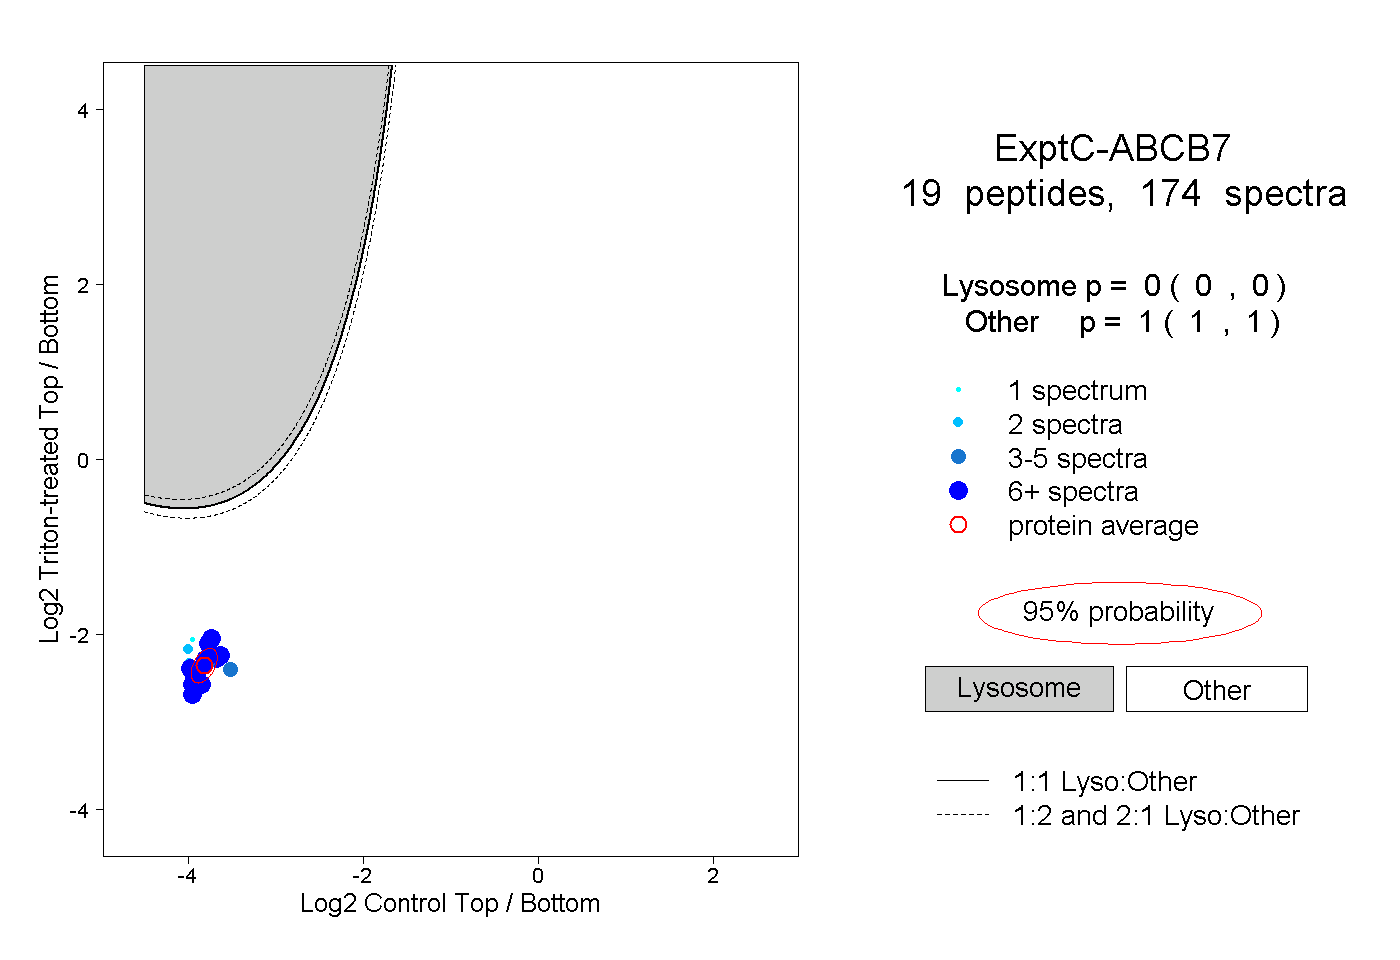
0.000 | 0.000
1.000 | 1.000
7peptides
spectra
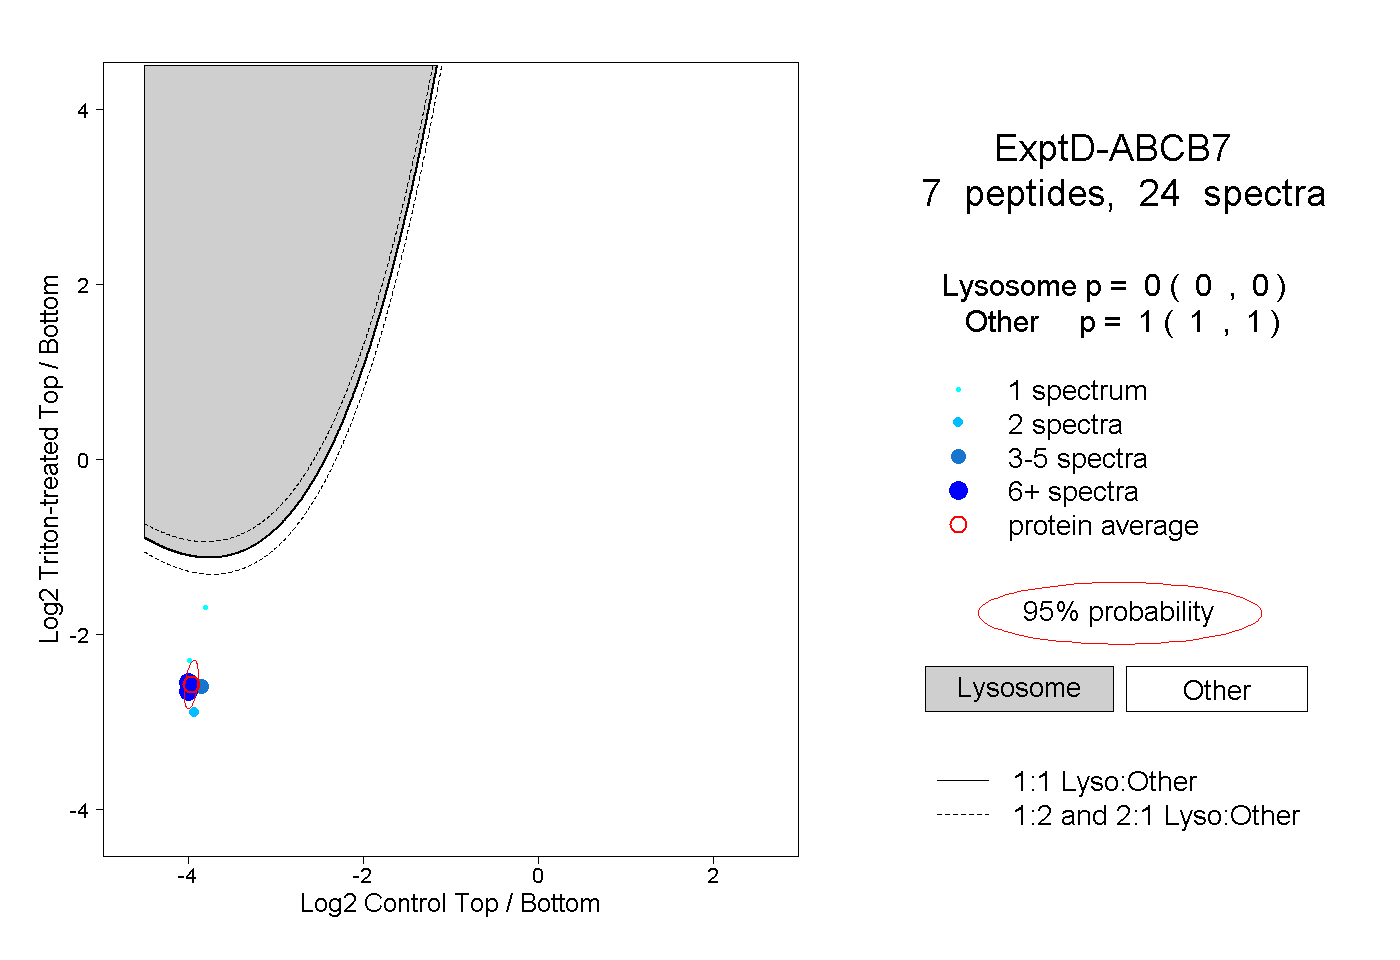
0.000 | 0.000
1.000 | 1.000