 15
15peptides
spectra
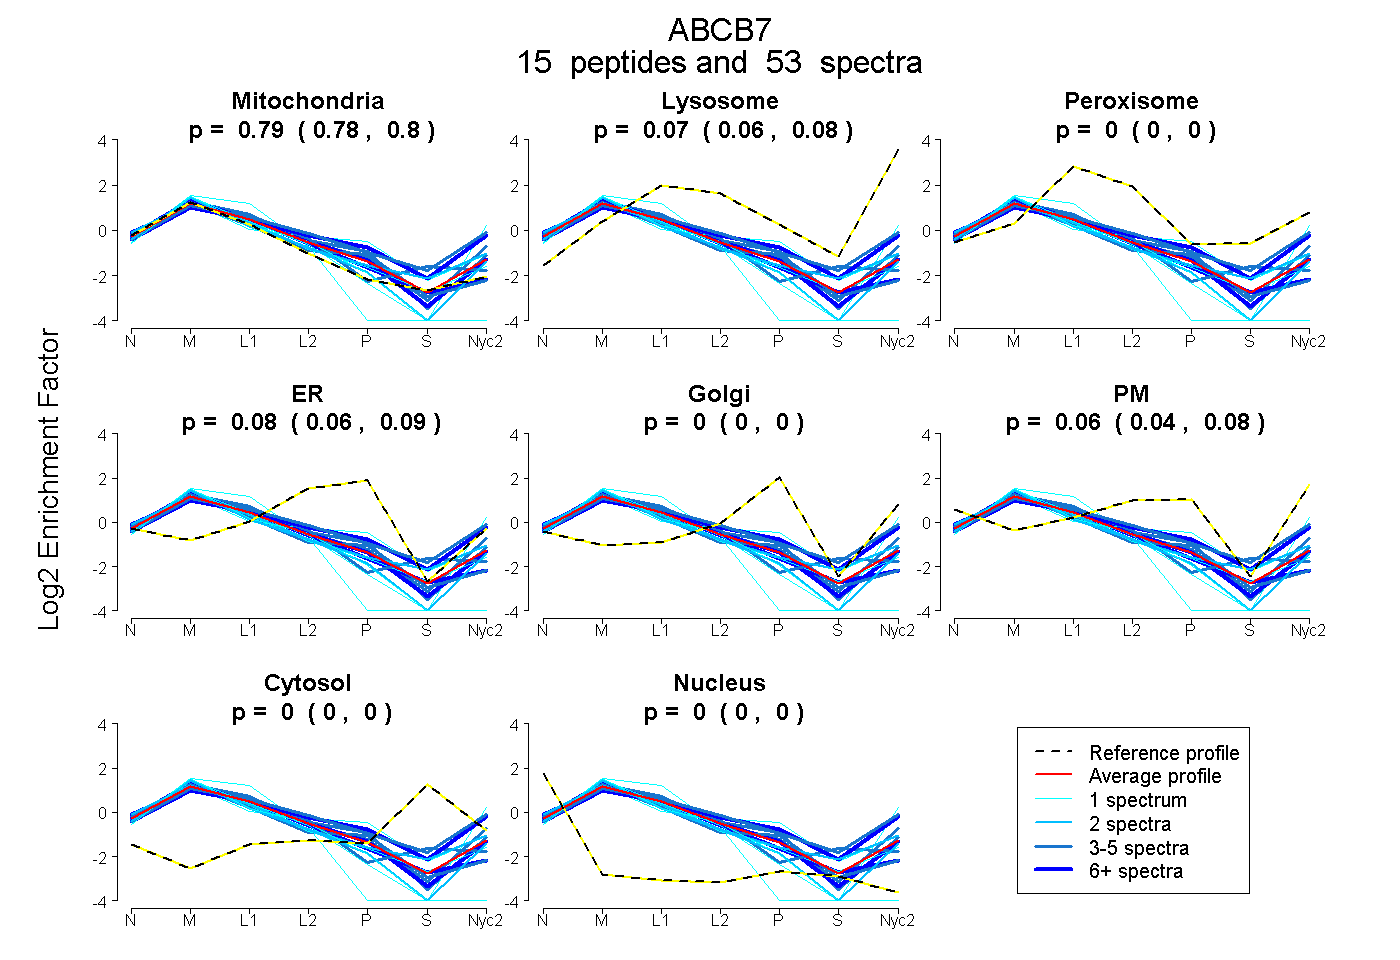
0.783 | 0.798
0.063 | 0.077
0.000 | 0.000
0.060 | 0.095
0.000 | 0.000
0.040 | 0.076
0.000 | 0.000
0.000 | 0.000
| Plot | Mito | Lyso | Perox | ER | Golgi | PM | Cytosol | Nucleus | |||||
| Expt A |
15 peptides |
53 spectra |
|
0.791 0.783 | 0.798 |
0.070 0.063 | 0.077 |
0.000 0.000 | 0.000 |
0.079 0.060 | 0.095 |
0.000 0.000 | 0.000 |
0.060 0.040 | 0.076 |
0.000 0.000 | 0.000 |
0.000 0.000 | 0.000 |
| 1 spectrum, NAVFGK | 0.640 | 0.081 | 0.000 | 0.153 | 0.126 | 0.000 | 0.000 | 0.000 | ||
| 4 spectra, AGAAFFNEVR | 0.723 | 0.010 | 0.000 | 0.112 | 0.000 | 0.156 | 0.000 | 0.000 | ||
| 3 spectra, QALIDMNTLFTLLK | 0.768 | 0.000 | 0.162 | 0.000 | 0.000 | 0.000 | 0.071 | 0.000 | ||
| 6 spectra, LAGLHDAILR | 0.796 | 0.010 | 0.000 | 0.068 | 0.000 | 0.125 | 0.000 | 0.000 | ||
| 2 spectra, YDGFLK | 0.898 | 0.000 | 0.000 | 0.000 | 0.000 | 0.102 | 0.000 | 0.000 | ||
| 1 spectrum, VLSGVSFEVPAGK | 0.945 | 0.028 | 0.000 | 0.000 | 0.000 | 0.027 | 0.000 | 0.000 | ||
| 5 spectra, LQEEIVNSVK | 0.847 | 0.000 | 0.000 | 0.153 | 0.000 | 0.000 | 0.000 | 0.000 | ||
| 1 spectrum, LSTVVDADEIIVLSQGK | 0.894 | 0.060 | 0.000 | 0.000 | 0.046 | 0.000 | 0.000 | 0.000 | ||
| 1 spectrum, AMASPLQITPQTATVAFDNVHFEYIEGQK | 0.834 | 0.166 | 0.000 | 0.000 | 0.000 | 0.000 | 0.000 | 0.000 | ||
| 10 spectra, AMNIVVPFMFK | 0.889 | 0.000 | 0.002 | 0.110 | 0.000 | 0.000 | 0.000 | 0.000 | ||
| 4 spectra, VAISLGFLGGAK | 0.589 | 0.272 | 0.014 | 0.000 | 0.011 | 0.088 | 0.027 | 0.000 | ||
| 9 spectra, TSIFIAHR | 0.594 | 0.225 | 0.000 | 0.000 | 0.108 | 0.072 | 0.000 | 0.000 | ||
| 2 spectra, TYETASLK | 0.786 | 0.095 | 0.000 | 0.000 | 0.000 | 0.092 | 0.027 | 0.000 | ||
| 3 spectra, AMLSYVWPK | 0.725 | 0.087 | 0.000 | 0.000 | 0.000 | 0.188 | 0.000 | 0.000 | ||
| 1 spectrum, YFNNEK | 0.981 | 0.000 | 0.000 | 0.000 | 0.000 | 0.000 | 0.000 | 0.019 |
| Plot | Mito | Lyso or Perox | ER | Golgi | PM | Cytosol | Nucleus | ||||||
| Expt B |
8 peptides |
23 spectra |
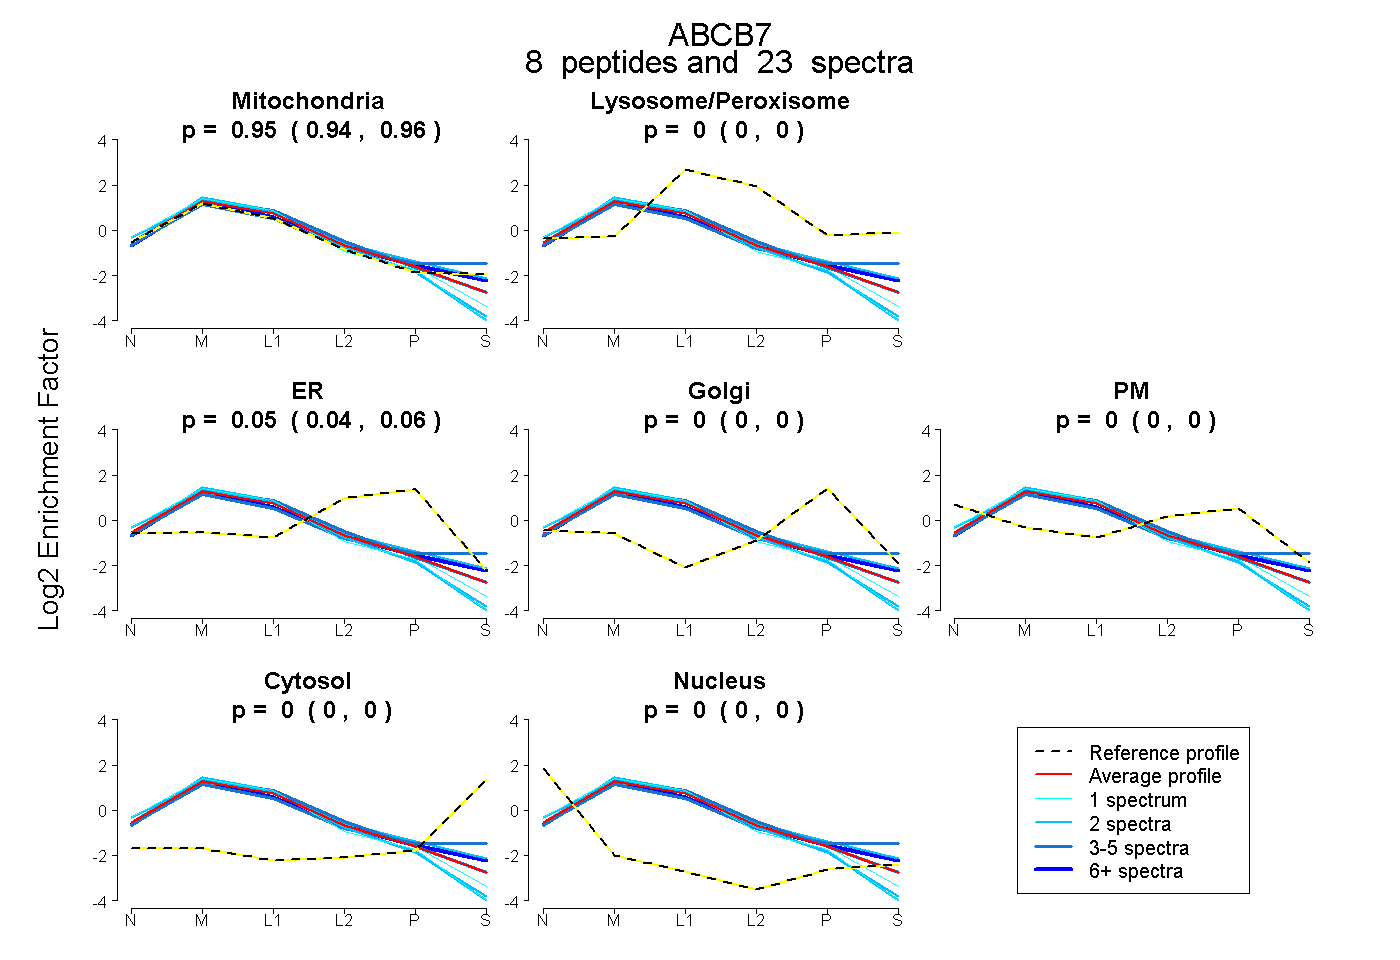 |
0.951 0.941 | 0.958 |
0.000 0.000 | 0.000 |
0.049 0.040 | 0.057 |
0.000 0.000 | 0.000 |
0.000 0.000 | 0.000 |
0.000 0.000 | 0.000 |
0.000 0.000 | 0.000 |
|||
| Plot | Lyso | Other | |||||||||||
| Expt C |
19 peptides |
174 spectra |
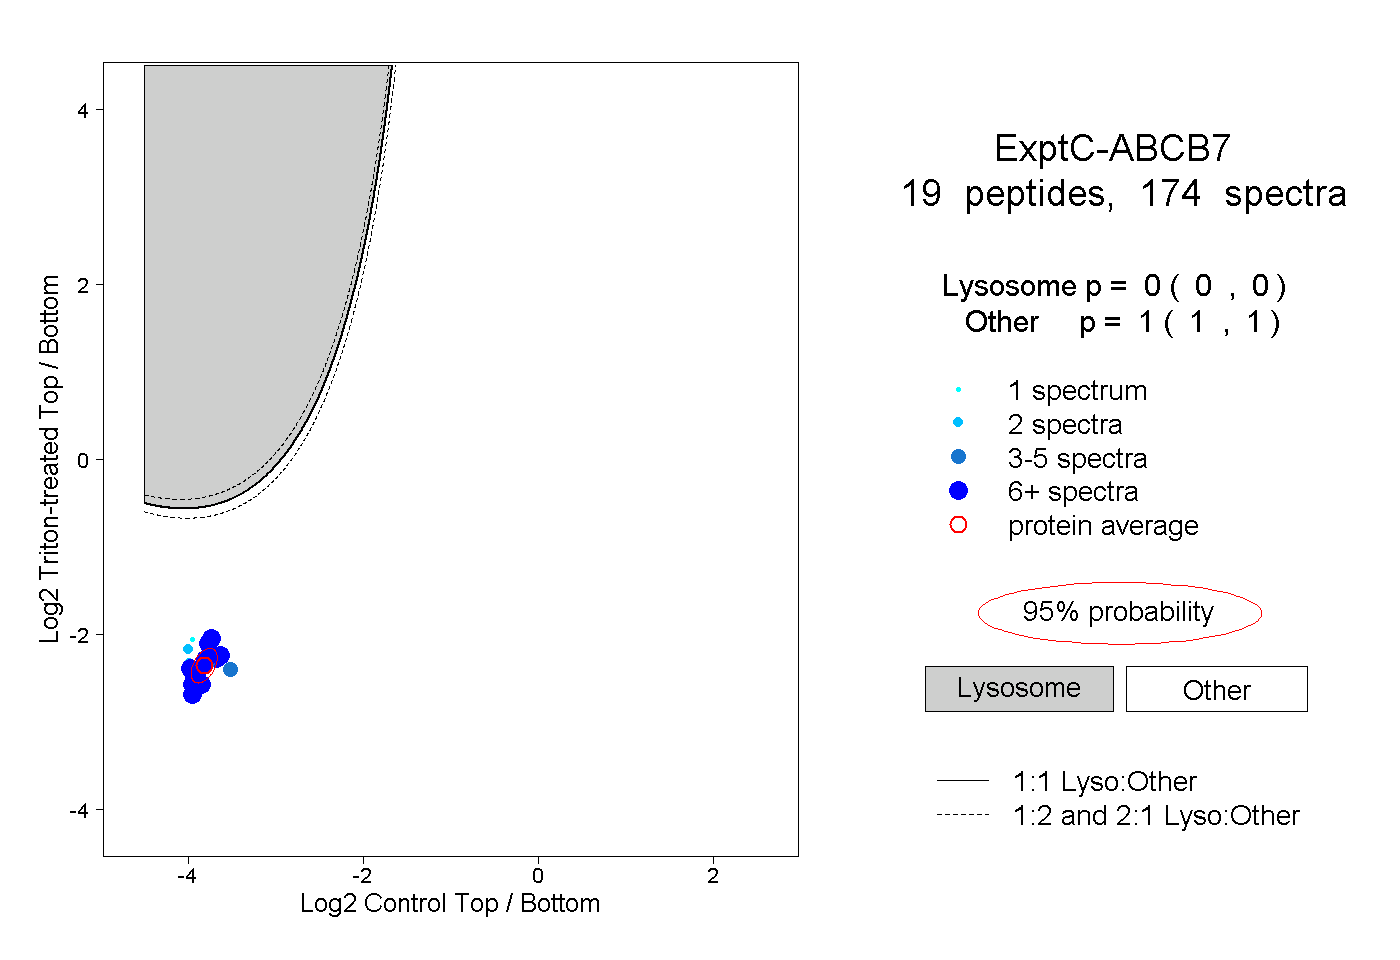 |
0.000 0.000 | 0.000 |
1.000 1.000 | 1.000 |
||||||||
| Plot | Lyso | Other | |||||||||||
| Expt D |
7 peptides |
24 spectra |
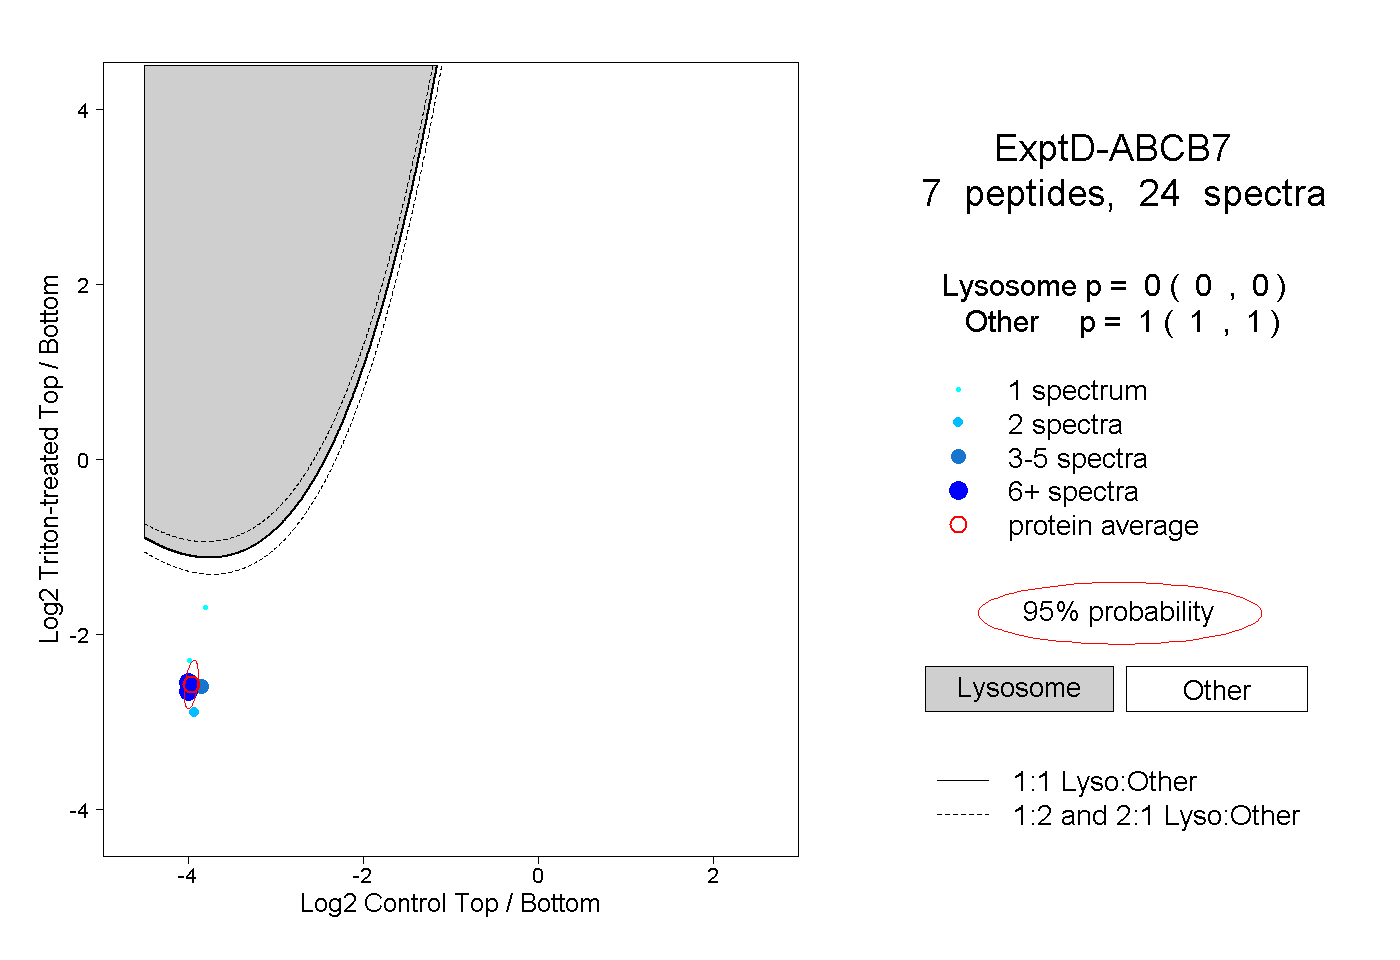 |
0.000 0.000 | 0.000 |
1.000 1.000 | 1.000 |