 22
22peptides
spectra
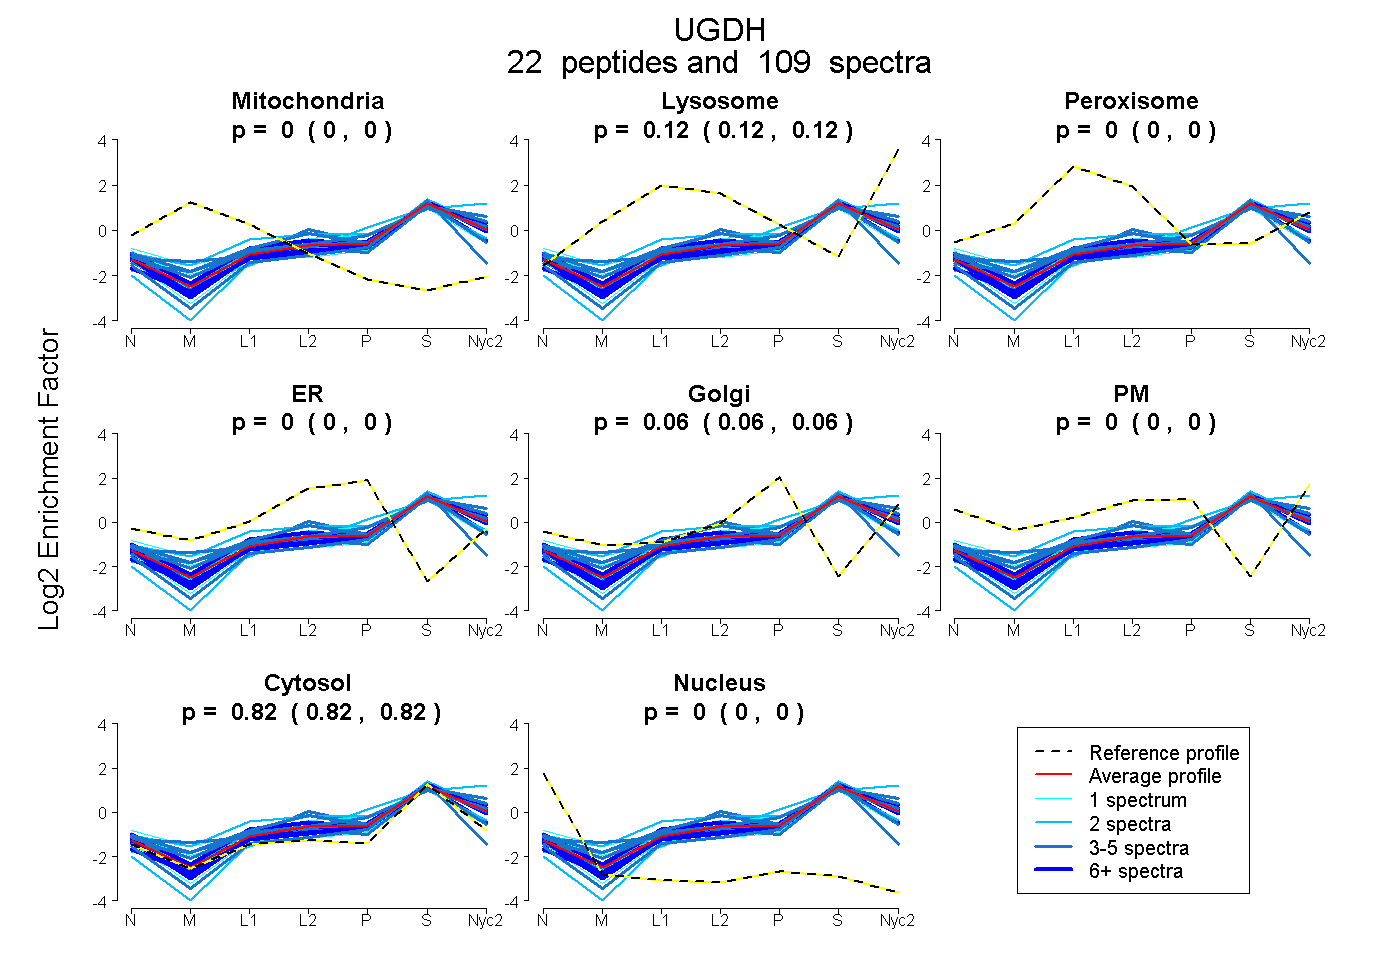
0.000 | 0.000
0.116 | 0.122
0.000 | 0.000
0.000 | 0.000
0.055 | 0.059
0.000 | 0.000
0.821 | 0.825
0.000 | 0.000
16peptides
spectra
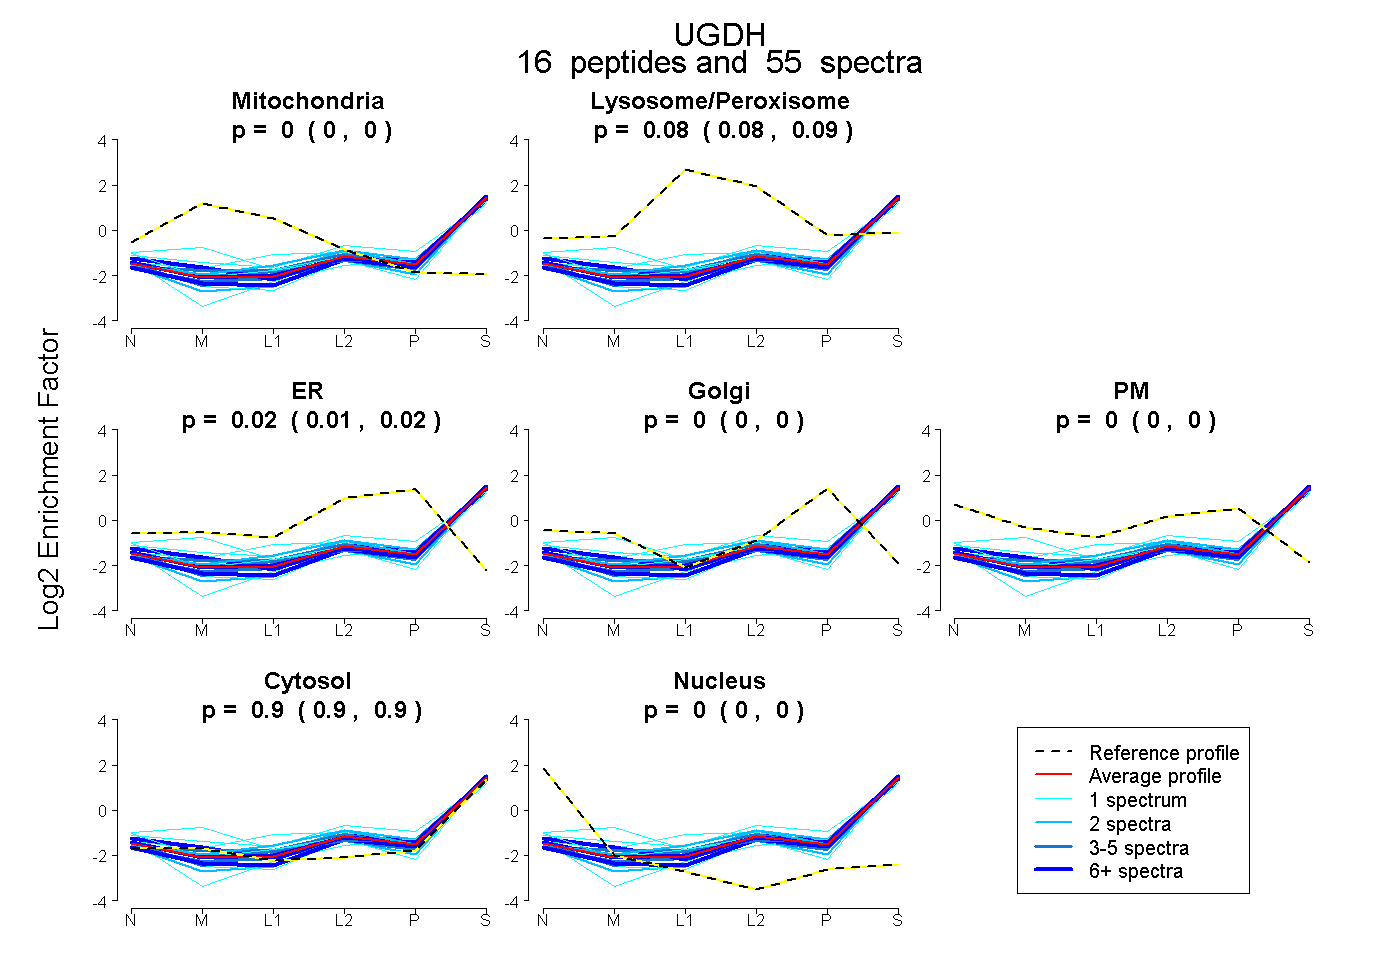
0.000 | 0.000
0.080 | 0.089
0.013 | 0.020
0.000 | 0.000
0.000 | 0.000
0.896 | 0.900
0.000 | 0.000
23peptides
spectra

0.000 | 0.000
1.000 | 1.000
6peptides
spectra

0.000 | 0.001
0.999 | 1.000